Prometheus 是一个开源的系统监控和告警工具集。它通过HTTP协议从目标系统拉取监控指标,并将这些数据存储在本地的时间序列数据库中。Prometheus 内置了强大的查询语言 PromQL,方便查询和聚合存储的指标数据,同时也支持创建图表和定义警报规则。
其核心架构主要包含两个部分:
- Prometheus Server:负责指标的抓取(Scraping)、存储、查询及告警规则的触发。
- Exporter:暴露被监控服务的指标接口,例如 Node Exporter 用于监控主机,MySQL Exporter 用于监控数据库等。
1. 安装 Prometheus
你可以从 Prometheus 的官方网站下载最新版本:https://prometheus.io/download/
1.1 下载 Prometheus
这里以较旧的 v2.3.0 版本为例进行演示,实际部署时建议下载最新的稳定版本。
# 下载 Prometheus
wget https://github.com/prometheus/prometheus/releases/download/v2.3.0/prometheus-2.3.0.linux-amd64.tar.gz
# 解压文件
tar -zxvf prometheus-2.3.0.linux-amd64.tar.gz
cd prometheus-2.3.0.linux-amd64
1.2 目录结构
解压后的目录包含以下主要文件和目录:
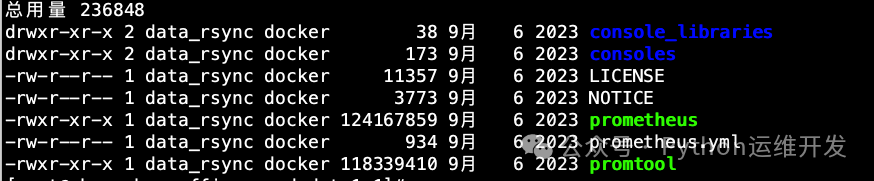
prometheus:主启动执行文件。promtool:命令行工具,用于验证配置文件和规则。prometheus.yml:主配置文件。rules/ 与 target/:需要手动创建,用于存放告警规则文件和被监控目标的配置文件。
ll rules/

ll target/node/

consoles/:存放 Web 控制台模板。
1.3 启动 Prometheus
# 启动 Prometheus
nohup ./prometheus --config.file=prometheus.yml \
--web.enable-lifecycle \
--web.listen-address=192.168.1.139:8001 &
--web.enable-lifecycle 参数启用了管理API,支持通过HTTP请求热重载配置。--web.listen-address 指定了服务监听地址和端口(默认是 :9090)。启动后,可以通过浏览器访问 http://192.168.1.139:8001 进入Prometheus的Web UI。
2. Node Exporter 安装(监控主机)
Node Exporter 用于暴露主机级别的硬件和操作系统指标。
cd /opt/soft/
#解压
tar -zxvf node_exporter-1.3.1.linux-amd64.tar.gz
#进入安装目录
cd /opt/soft/node_exporter-1.3.1.linux-amd64
#启动 (collector.textfile.directory 参数指定了存放自定义指标数据的目录,后文会有说明)
nohup ./node_exporter --collector.textfile.directory=./key &
访问 http://127.0.0.1:9100/metrics,若返回大量以 # HELP 和 # TYPE 开头的文本数据,说明 Node Exporter 已正常工作。这标志着你的监控系统基础组件已就绪,是构建更复杂 运维 & 测试 体系的第一步。
# HELP go_gc_duration_seconds A summary of the pause duration of garbage collection cycles.
# TYPE go_gc_duration_seconds summary
go_gc_duration_seconds{quantile="0"} 1.6425e-05
go_gc_duration_seconds{quantile="0.25"} 3.4856e-05
go_gc_duration_seconds{quantile="0.5"} 5.8672e-05
go_gc_duration_seconds{quantile="0.75"} 8.4572e-05
go_gc_duration_seconds{quantile="1"} 0.000452457
go_gc_duration_seconds_sum 12.595550358
go_gc_duration_seconds_count 185069
# HELP go_goroutines Number of goroutines that currently exist.
# TYPE go_goroutines gauge
go_goroutines 7
# HELP go_info Information about the Go environment.
3. 配置 Prometheus
Prometheus 的核心配置文件是 prometheus.yml,采用 YAML 格式。
3.1 全局配置
# my global config
global:
  scrape_interval:     15s # 抓取(scrape)间隔时间, 默认是1分钟
  evaluation_interval: 15s # 规则评估间隔默认也是 1 分钟
3.2 Alertmanager 配置
这部分配置告警管理器 Alertmanager 的地址,用于接收 Prometheus 发出的告警并路由通知。
# Alertmanager configuration
alerting:
  alertmanagers:
  - static_configs:
    - targets:
      - 127.0.0.1:9093 #这里配置Alertmanager的地址
3.3 规则文件配置
rule_files 定义了告警规则文件的路径。Prometheus 会加载指定路径下所有规则文件里定义的告警条件,并按照 global.evaluation_interval 周期性地进行评估。
# 加载规则一次,并根据全局“evaluation_interval”定期对其进行评估
rule_files:
    - /data/prometheus-2.3.0.linux-amd64/rules/*.rules
    - /data/prometheus-2.3.0.linux-amd64/rules/*.yml
#*.yml、*.rules代表所有此后缀的文件如1.rules、2.rules
3.4 抓取目标配置
scrape_configs 部分定义了 Prometheus 要抓取哪些目标(Targets)的指标。这里展示了两种常见的配置方式:静态配置和基于文件的服务发现。
静态配置示例(监控Prometheus自身):
- job_name: 'prometheus'
  static_configs:
  - targets: ['192.168.1.139:8001']
    labels:
        instance: prometheus
基于文件的服务发现示例(监控Node Exporter和Java应用):
这种方式更灵活,新增或移除监控目标无需重启 Prometheus。
- job_name: 'node' #存放node-exporter的配置
  file_sd_configs:
  - files:
    - "/data/prometheus-2.3.0.linux-amd64/target/node/*.json"
    refresh_interval: 6s
- job_name: 'application' #监控后端业务应用
  metrics_path: /actuator/prometheus # 注意metrics_path,Java Spring Boot应用常见的指标端点
  file_sd_configs:
  - files:
    - "/data/prometheus-2.3.0.linux-amd64/target/application/*.json"
    refresh_interval: 6s
注意 metrics_path:node_exporter 的默认指标路径是 /metrics,因此 job_name: 'node' 中未指定。而示例中的 Java 应用通过 spring-boot-actuator 暴露指标,端点为 /actuator/prometheus,所以需要显式配置。这体现了不同 数据库/中间件/技术栈 组件接入 Prometheus 时的差异。
3.5 完整的配置文件示例
global:
  scrape_interval:     15s
  evaluation_interval: 15s

alerting:
  alertmanagers:
  - static_configs:
    - targets:
      - 127.0.0.1:9093

rule_files:
    - /data/prometheus-2.3.0.linux-amd64/rules/*.rules
    - /data/prometheus-2.3.0.linux-amd64/rules/*.yml

scrape_configs:
  #prometheus自己
  - job_name: 'prometheus'
    static_configs:
    - targets: ['192.168.1.139:8001']
      labels:
          instance: prometheus
  - job_name: 'node' #存放node-export的配置
    file_sd_configs:
    - files:
      - "/data/prometheus-2.3.0.linux-amd64/target/node/*.json"
      refresh_interval: 6s
  - job_name: 'application' #后端业务应用的配置
    metrics_path: /actuator/prometheus
    file_sd_configs:
    - files:
      - "/data/prometheus-2.3.0.linux-amd64/target/application/*.json"
      refresh_interval: 6s
3.6 添加被监控目标配置文件
根据上面的 file_sd_configs 配置,我们需要在指定目录下创建 JSON 文件来定义具体的目标。
#targets 目标主机地址
#labels 监控目标主机的标签,结合Alertmanager通知模板,这些标签可以展示到告警通知的内容里
[root@test node]# cat 192.168.1.139.json
[
  {
    "targets":  ["192.168.1.139:9100"],
    "labels": {
        "env": "test",
        "servicename": "测试",
        "hostname": "测试机"
    }
  }
]
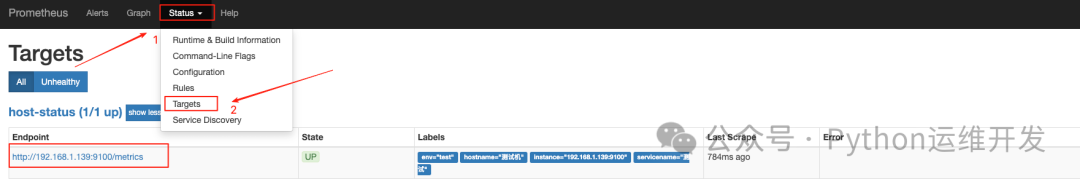
创建好后,将文件放在 /data/prometheus-2.3.0.linux-amd64/target/node/ 目录下。Prometheus 会定时扫描(refresh_interval: 6s)并自动加载新配置。访问 http://192.168.1.139:8001/targets,可以看到 192.168.1.139:9100 已经被成功发现并处于 UP 状态。
4. 自定义告警规则实战
下面通过一个监控特定端口(以 Nexus 私服的 8082 端口为例)的完整流程,演示如何结合脚本与告警规则实现自定义监控。
4.1 创建告警规则文件
首先,在规则目录下创建规则文件,例如 zidingyi.rules。
[root@test rules]# cat zidingyi.rules
groups: # 规则组
- name: port # 规则组的名称
  rules:
  - alert: nexus(私服) #告警名称
    expr: nexus == 0 # 当指标nexus的值为0时触发告警
    # for: 1m #持续多久后发送。不设置则状态变化后立即触发。
    labels:
      severity: "紧急"
    annotations: #告警详情
      summary: "端口不通"
      description: "模版测试收到请忽略"
将文件 zidingyi.rules 放到 /data/prometheus-2.3.0.linux-amd64/rules/ 路径下,Prometheus 会自动加载。
4.2 在 Node Exporter 端创建自定义指标采集脚本
这个脚本用于检查端口是否存在,并将结果输出到特定格式的文件中。
cat /opt/soft/node_exporter-1.3.1.linux-amd64/key/key_runner.sh
#!/bin/bash
echo "nexus" `netstat -tunlp|grep 8082|wc -l`
#当8082端口不存在时会打印 `nexus 0`
#我们监控规则里定义 `expr: nexus == 0` 时发送通知
4.3 通过 Cron 任务定时执行脚本
添加一个 crontab 任务,每分钟执行一次脚本,并将输出重定向到 Node Exporter 的文本文件收集目录。
*/1 * * * * /bin/bash /opt/soft/node_exporter-1.3.1.linux-amd64/key/key_runner.sh >/opt/soft/node_exporter-1.3.1.linux-amd64/key/key.prom
关键点:脚本输出的格式必须是 指标名 值,例如 nexus 1 或 nexus 0。Node Exporter 启动时通过 --collector.textfile.directory=./key 参数指定了该目录,它会自动收集 *.prom 文件中的指标供 Prometheus 抓取。这样,告警规则中的 expr: nexus == 0 就能根据这个值来判断是否触发告警。
通过以上步骤,我们完成了从 Prometheus 和 Node Exporter 的基础安装、核心配置解析,到利用文件服务发现动态管理监控目标,最后通过自定义脚本和告警规则实现业务层面的监控。希望这份结合了具体操作和原理说明的指南,能帮助你在实际运维中更好地搭建和运用 Prometheus 监控体系。如果在实践中遇到更多有趣的监控场景或配置技巧,欢迎到 云栈社区 与大家交流分享。
注:本文内容为技术经验总结,仅供参考。实际部署时,请结合自身业务场景、环境特性及安全要求调整配置,操作前建议备份关键数据并在测试环境验证。
 发表于 2026-4-11 08:49:05
|
查看: 180|
回复: 0
发表于 2026-4-11 08:49:05
|
查看: 180|
回复: 0
