本文将通过 Python 脚本,结合 yfinance 获取实时股票数据,计算一系列技术指标,并利用 Ollama 驱动的 AI 模型生成自然语言分析,实现对股票走势的自动化监控与解读。
核心步骤与技术栈
整个流程主要包含以下几个部分:
- 数据获取:使用
yfinance 库获取苹果(AAPL)和道琼斯指数(^DJI)的分钟级历史数据。
- 指标计算:计算5分钟滚动均价、指数移动平均线(EMA)、相对强弱指数(RSI)、布林带等。
- AI 解读:将计算出的指标组合成提示词,交由本地运行的 Ollama 大模型(如 Llama 3)生成市场分析洞察。
- 模拟与可视化:使用
schedule 库模拟实时数据流,并初步展示了 Streamlit 构建简单界面的思路。
代码实现详解
首先,导入必要的 Python 库。
import yfinance as yf
import pandas as pd
import schedule
import time
import ollama
from datetime import datetime, timedelta
1. 获取历史数据
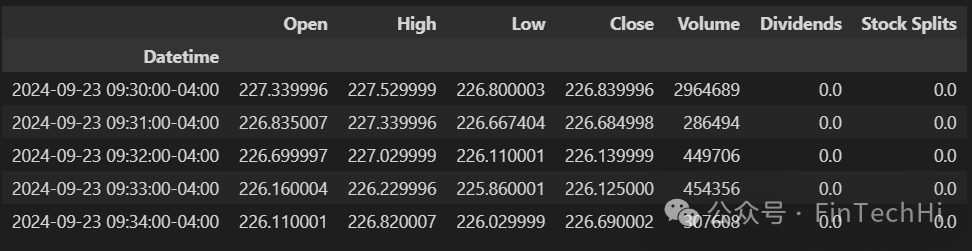
使用 yfinance 获取前一天苹果股票和道琼斯指数的1分钟间隔数据。
stock = yf.Ticker(“AAPL”)
dow_jones = yf.Ticker(“^DJI”)
data = stock.history(period=“1d”, interval=“1m”)
dow_data = dow_jones.history(period=“1d”, interval=“1m”)
data.head()
2. 初始化全局变量
定义用于滚动计算和跟踪市场状态的全局变量。
rolling_window = pd.DataFrame()
dow_rolling_window = pd.DataFrame()
# Variables to track daily context
daily_high = float(‘-inf’)
daily_low = float(‘inf’)
buying_momentum = 0
selling_momentum = 0
rolling_window 和 dow_rolling_window 用于存储滚动数据窗口。daily_high 和 daily_low 初始化为极值,用于更新当日的最高价和最低价。buying_momentum 和 selling_momentum 用于量化当日的买入和卖出动量。
3. 辅助函数:计算市场开盘时长
此函数根据数据窗口中的最新时间戳,计算自当天开盘(09:30:00)以来经过的分钟数。
def get_market_open_duration(window):
    # Extract current time from the last element of the window
    current_time = window.index[-1].time()  # Returns a datetime.time object

    # Get the previous trading day‘s date
    previous_trading_day = datetime.today() - timedelta(days=1)

    # Combine the previous trading day with the current time
    current_datetime = datetime.combine(previous_trading_day, current_time)

    # Define the market opening time as 09:30:00 on the previous trading day
    market_start_time = datetime.combine(previous_trading_day, datetime.strptime(“09:30:00”, “%H:%M:%S”).time())

    # Calculate the duration the market has been open in minutes
    market_open_duration = (current_datetime - market_start_time).total_seconds() / 60  # in minutes

    return market_open_duration
4. 核心函数:调用 AI 生成洞察
这是项目的亮点,将计算好的所有技术指标打包成一个提示词,发送给 Ollama 中的大模型(例如 Llama 3),请求其以专业股票经纪人的口吻生成简洁的分析。
def get_natural_language_insights(
    rolling_avg, ema, rsi, bollinger_upper, bollinger_lower,
    price_change, volume_change, dow_rolling_avg, market_open_duration, dow_price_change, dow_volume_change, daily_high, daily_low, buying_momentum, selling_momentum
):
    prompt = f”“”
    You are a professional stock broker. Apple‘s stock has a 5-minute rolling average of {rolling_avg:.2f}.
    The Exponential Moving Average (EMA) is {ema:.2f}, and the Relative Strength Index (RSI) is {rsi:.2f}.
    The Bollinger Bands are set with an upper band of {bollinger_upper:.2f} and a lower band of {bollinger_lower:.2f}.
    The price has changed by {price_change:.2f}, and the volume has shifted by {volume_change}.
    The DOW price has changed by {dow_price_change:.2f}, and the volume has shifted by {dow_volume_change}.
    Meanwhile, the Dow Jones index has a 5-minute rolling average of {dow_rolling_avg:.2f}.
    The market has been open for {market_open_duration:.2f} minutes.
    Today’s high was {daily_high:.2f} and low was {daily_low:.2f}.
    The buying momentum is {buying_momentum:.2f} and selling momentum is {selling_momentum:.2f}.
    Based on this data, provide insights into the current stock trend and the general market sentiment.
    The insights should not be longer than 100 words and should not have an introduction.
    ”””
    response = ollama.chat(
            model=“llama3”,
            messages=[{“role”: “user”, “content”: prompt}]
        )
    response_text = response[‘message’][‘content’].strip()

# Print the natural language insight
    print(“Natural Language Insight:”, response_text)
5. 核心函数:计算技术指标
此函数是数据分析的核心,它基于最新的5分钟数据窗口计算所有定义的技术指标。
def calculate_insights(window, dow_window):
if len(window) >= 5:
# Calculate 5-minute rolling average of the ‘Close’ prices
rolling_avg = window[‘Close’].rolling(window=5).mean().iloc[-1]
# Calculate price change and volume change
price_change = window[‘Close’].iloc[-1] - window[‘Close’].iloc[-2] if len(window) >= 2 else 0
volume_change = window[‘Volume’].iloc[-1] - window[‘Volume’].iloc[-2] if len(window) >= 2 else 0
# Calculate DOW price change and volume change
dow_price_change = dow_window[‘Close’].iloc[-1] - dow_window[‘Close’].iloc[-2] if len(dow_window) >= 2 else 0
dow_volume_change = dow_window[‘Volume’].iloc[-1] - dow_window[‘Volume’].iloc[-2] if len(dow_window) >= 2 else 0
# Calculate Exponential Moving Average (EMA) and Bollinger Bands (with a 5-period window)
ema = window[‘Close’].ewm(span=5, adjust=False).mean().iloc[-1]
std = window[‘Close’].rolling(window=5).std().iloc[-1]
bollinger_upper = rolling_avg + (2 * std)
bollinger_lower = rolling_avg - (2 * std)
# Calculate Relative Strength Index (RSI) if there are enough periods (14 is typical)
delta = window[‘Close’].diff()
gain = delta.where(delta > 0, 0)
loss = -delta.where(delta < 0, 0)
avg_gain = gain.rolling(window=14, min_periods=1).mean().iloc[-1]
avg_loss = loss.rolling(window=14, min_periods=1).mean().iloc[-1]
rs = avg_gain / avg_loss if avg_loss != 0 else float(‘nan’)
rsi = 100 - (100 / (1 + rs))
# Calculate Dow Jones index rolling average
dow_rolling_avg = dow_window[‘Close’].rolling(window=5).mean().iloc[-1]
market_open_duration = get_market_open_duration(window)
# Print the calculated insights
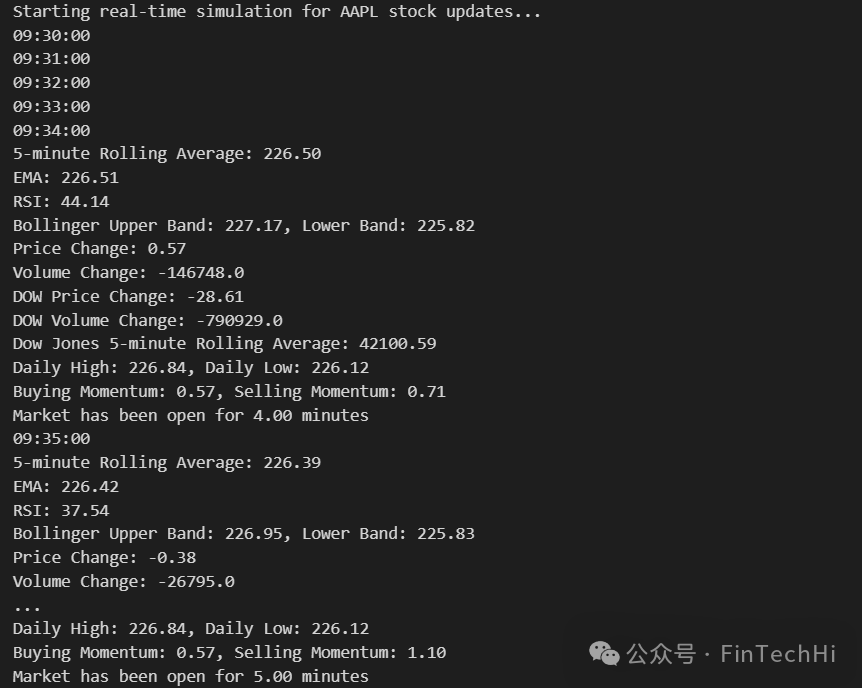
print(f“5-minute Rolling Average: {rolling_avg:.2f}”)
print(f“EMA: {ema:.2f}”)
print(f“RSI: {rsi:.2f}”)
print(f“Bollinger Upper Band: {bollinger_upper:.2f}, Lower Band: {bollinger_lower:.2f}”)
print(f“Price Change: {price_change:.2f}”)
print(f“Volume Change: {volume_change}”)
print(f“DOW Price Change: {dow_price_change:.2f}”)
print(f“DOW Volume Change: {dow_volume_change}”)
print(f“Dow Jones 5-minute Rolling Average: {dow_rolling_avg:.2f}”)
print(f“Daily High: {daily_high:.2f}, Daily Low: {daily_low:.2f}”)
print(f“Buying Momentum: {buying_momentum:.2f}, Selling Momentum: {selling_momentum:.2f}”)
print(f“Market has been open for {market_open_duration:.2f} minutes”)
if int(market_open_duration) % 5 == 0: # Trigger LLM every 5 minutes
get_natural_language_insights(
rolling_avg, ema, rsi, bollinger_upper, bollinger_lower,
price_change, volume_change, dow_rolling_avg, market_open_duration, dow_price_change, dow_volume_change, daily_high, daily_low, buying_momentum, selling_momentum
)
6. 核心函数:处理每分钟数据更新
此函数模拟每分钟接收到新数据的过程,更新滚动窗口、计算每日高/低点和动量,并调用 calculate_insights 函数。
def process_stock_update():
    global rolling_window, data, dow_rolling_window, dow_data
    global daily_high, daily_low, buying_momentum, selling_momentum
    if not data.empty and not dow_data.empty:
        # Simulate receiving a new data point for AAPL and Dow Jones
        update = data.iloc[0].to_frame().T
        time_str = update.index[0].time()
        print(time_str)  # Output: [‘09:30:00’]
        dow_update = dow_data.iloc[0].to_frame().T
        data = data.iloc[1:]  # Safely remove the first row without causing index issues
        dow_data = dow_data.iloc[1:]
        # Append the new data points to the rolling windows
        rolling_window = pd.concat([rolling_window, update], ignore_index=False)
        dow_rolling_window = pd.concat([dow_rolling_window, dow_update], ignore_index=False)
        # Update daily high and low
        daily_high = max(daily_high, update[‘Close’].values[0])
        daily_low = min(daily_low, update[‘Close’].values[0])
        # Calculate momentum based on price changes
        if len(rolling_window) >= 2:
            price_change = update[‘Close’].values[0] - rolling_window[‘Close’].iloc[-2]
            if price_change > 0:
                buying_momentum += price_change
            else:
                selling_momentum += abs(price_change)

        # Limit the rolling window to 5 minutes for moving average
        if len(rolling_window) > 5:
            rolling_window = rolling_window.iloc[1:]
        if len(dow_rolling_window) > 5:
            dow_rolling_window = dow_rolling_window.iloc[1:]
        # Calculate insights (moving averages, Bollinger Bands, RSI, etc.)
        calculate_insights(rolling_window, dow_rolling_window)
7. 调度与运行
使用 schedule 库,设定每10秒(模拟1分钟)执行一次 process_stock_update 函数,启动实时模拟。
schedule.every(10).seconds.do(process_stock_update)
# Run the scheduled jobs
print(“Starting real-time simulation for AAPL stock updates...”)
while True:
    schedule.run_pending()
    time.sleep(1)
运行效果与 AI 解读
启动脚本后,控制台会打印出每一“分钟”计算出的技术指标,并在每过5分钟时调用 AI 模型生成分析洞察。
例如,AI(Llama 3模型)可能生成如下分析:
Natural Language Insight: Apple‘s price is consolidating within the Bollinger Bands, with a slight dip to 226.39. The EMA and rolling average are slightly higher, indicating a short-term uptrend. The RSI of 37.54 suggests the stock may be oversold, potentially leading to a bounce. The buying momentum is higher than selling momentum, implying investors are still cautiously optimistic. With the Dow Jones index also experiencing a slight decline, it’s possible Apple‘s strength could lead it outperforming the broader market in the short term.
扩展:Streamlit 可视化界面
我们可以使用 Streamlit 快速构建一个更友好的交互界面来展示这个过程。
# Streamlit UI
st.title(“AI Stock Advisor”)
logtxtbox = st.empty()
logtxt = ‘09:30:00’
logtxtbox.caption(logtxt)
message = st.chat_message(“assistant”)
message.write(“Starting real-time simulation for AAPL stock updates. First update will be processed in 5 minutes...”)
总结
本项目演示了如何将传统的金融数据分析与前沿的大语言模型本地部署工具 Ollama 相结合。通过 Python 自动化脚本,我们不仅能实时计算复杂的技术指标,还能获得 AI 生成的、易于理解的市场解读,为量化交易或投资分析提供了一个创新的辅助工具思路。你可以尝试更换不同的股票代码、调整技术指标参数,或者体验 Ollama 中的其他模型(如 CodeLlama, Mistral 等)来获得不同风格的分析报告。
对金融数据分析与AI结合感兴趣的开发者,欢迎在 云栈社区 交流更多实践想法。
 发表于 2026-4-20 13:50:00
|
查看: 178|
回复: 0
发表于 2026-4-20 13:50:00
|
查看: 178|
回复: 0
