当你的 Java 应用突然抛出 Connection is not available, request timed out 这类错误时,多半是数据库连接池告急了。这不仅是高频面试题,更是令开发者头痛的线上生产问题。连接池一旦爆满,会导致应用响应缓慢甚至服务不可用。本文将带你系统化地梳理从问题诊断、原因定位到解决方案的全过程,并提供可直接用于生产的代码和脚本。
问题现象与快速诊断
连接池爆满通常伴随着一系列明确的错误信息,它们是问题排查的第一线索。
1. 连接池爆满的表现
应用日志中常见以下异常:
// 常见错误信息
com.mysql.cj.jdbc.exceptions.CommunicationsException: Communications link failure
com.zaxxer.hikari.pool.HikariPool$PoolInitializationException: Failed to initialize pool
java.sql.SQLTransientConnectionException: HikariPool-1 - Connection is not available, request timed out after 30000ms
org.springframework.dao.DataAccessResourceFailureException: Unable to acquire JDBC Connection
2. 快速诊断命令
出现告警后,第一步是快速确认现状。以下 Shell 脚本可以帮助你快速收集关键信息:
#!/bin/bash
# quick_connection_check.sh

echo "🔍 数据库连接池快速诊断"
echo "======================"

# 1. 查看应用连接池状态
APP_PID=$(jps -l | grep -v Jps | awk '{print $1}' | head -1)

if [ -n "$APP_PID" ]; then
echo “1. 应用连接池状态:”
# 如果有actuator端点
    curl -s http://localhost:8080/actuator/metrics/hikaricp.connections.active | jq . || echo “无法获取连接池指标”
fi

# 2. 查看数据库连接数
echo -e “\n2. 数据库连接状态:”
mysql -h localhost -u root -p‘password’ -e “
-- 查看最大连接数
SHOW VARIABLES LIKE ‘max_connections’;

-- 查看当前连接数
SHOW STATUS LIKE ‘Threads_connected’;

-- 查看连接详情
SELECT
    USER,
    HOST,
    DB,
    COMMAND,
    STATE,
    TIME,
    INFO
FROM information_schema.processlist
ORDER BY TIME DESC
LIMIT 20;

-- 查看等待连接
SHOW STATUS LIKE ‘Threads_running’;
SHOW STATUS LIKE ‘Aborted_connects’;
“

# 3. 查看网络连接
echo -e “\n3. 网络连接状态:”
netstat -an | grep :3306 | wc -l
netstat -an | grep :3306 | grep ESTABLISHED | wc -l

# 4. 快速判断
echo -e “\n4. 快速诊断:”
MAX_CONN=$(mysql -h localhost -u root -p‘password’ -sN -e “SHOW VARIABLES LIKE ‘max_connections’” | awk ‘{print $2}’)
CURR_CONN=$(mysql -h localhost -u root -p‘password’ -sN -e “SHOW STATUS LIKE ‘Threads_connected’” | awk ‘{print $2}’)

if [ “$CURR_CONN” -gt $((MAX_CONN * 80 / 100)) ]; then
echo “⚠️ 数据库连接接近上限: ${CURR_CONN}/${MAX_CONN}”
fi
连接池配置优化
合理的配置是预防问题的第一道防线。不同的连接池和场景需要不同的配置策略。
1. 主流连接池配置对比
Spring Boot 中常见的连接池配置示例如下,你可以根据项目需求选择 HikariCP、Druid 或 Tomcat JDBC Pool。
# Spring Boot配置示例
spring:
  datasource:
# HikariCP (Spring Boot 2.x默认)
    hikari:
      connection-timeout: 30000 # 连接超时30秒
      validation-timeout: 5000 # 验证超时5秒
      idle-timeout: 600000 # 空闲连接超时10分钟
      max-lifetime: 1800000 # 连接最大生命周期30分钟
      maximum-pool-size: 20 # 最大连接数
      minimum-idle: 10 # 最小空闲连接
      pool-name: HikariPool
      connection-test-query: SELECT 1
      leak-detection-threshold: 60000 # 泄漏检测阈值60秒
      initialization-fail-timeout: 1 # 初始化失败超时1毫秒(立即失败)
      register-mbeans: true # 注册JMX MBeans

# Druid配置
    druid:
      url: jdbc:mysql://localhost:3306/db
      username: root
      password: password
      initial-size: 5 # 初始化连接数
      min-idle: 5 # 最小空闲连接
      max-active: 50 # 最大连接数
      max-wait: 60000 # 获取连接最大等待时间
      time-between-eviction-runs-millis: 60000 # 检查间隔
      min-evictable-idle-time-millis: 300000 # 最小空闲时间
      validation-query: SELECT 1
      test-while-idle: true # 空闲时检查
      test-on-borrow: false # 获取时不检查
      test-on-return: false # 归还时不检查
      pool-prepared-statements: true # 缓存PreparedStatement
      max-pool-prepared-statement-per-connection-size: 20
      filters: stat,wall,slf4j           # 监控统计过滤器

# Tomcat JDBC Pool
    tomcat:
      initial-size: 5
      max-active: 20
      min-idle: 5
      max-idle: 10
      max-wait: 10000
      test-on-borrow: true
      validation-query: SELECT 1
2. 连接池选择与动态配置
对于如何在代码层面根据场景选择连接池,可以参考以下配置类。它展示了如何为高并发短事务场景配置 HikariCP,或为需要强大监控的场景配置 Druid。
@Configuration
public class DataSourceConfig {

    /**
     * 根据场景选择连接池
     */
    @Bean
    @ConditionalOnProperty(name = “spring.datasource.type“, havingValue = “hikari“, matchIfMissing = true)
    public DataSource hikariDataSource() {
        // 高并发、短事务场景
        HikariConfig config = new HikariConfig();
        config.setJdbcUrl(“jdbc:mysql://localhost:3306/db“);
        config.setUsername(“root“);
        config.setPassword(“password“);
        config.setMaximumPoolSize(calculateMaxPoolSize());  // 动态计算
        config.setConnectionTimeout(30000);
        config.setIdleTimeout(600000);
        config.setMaxLifetime(1800000);
        config.setLeakDetectionThreshold(60000);
        return new HikariDataSource(config);
    }

    @Bean
    @ConditionalOnProperty(name = “spring.datasource.type“, havingValue = “druid“)
    public DataSource druidDataSource() {
        // 需要监控、SQL防火墙场景
        DruidDataSource dataSource = new DruidDataSource();
        dataSource.setUrl(“jdbc:mysql://localhost:3306/db“);
        dataSource.setUsername(“root“);
        dataSource.setPassword(“password“);
        dataSource.setInitialSize(5);
        dataSource.setMinIdle(5);
        dataSource.setMaxActive(50);
        dataSource.setMaxWait(60000);
        dataSource.setTimeBetweenEvictionRunsMillis(60000);
        dataSource.setMinEvictableIdleTimeMillis(300000);
        dataSource.setValidationQuery(“SELECT 1“);
        dataSource.setTestWhileIdle(true);
        dataSource.setTestOnBorrow(false);
        dataSource.setTestOnReturn(false);

        try {
            dataSource.setFilters(“stat,wall,slf4j“);
        } catch (SQLException e) {
            log.error(“Druid配置过滤器失败“, e);
        }

        return dataSource;
    }

    /**
     * 动态计算最大连接数
     * 公式:max_connections = ((core_count * 2) + effective_spindle_count)
     */
    private int calculateMaxPoolSize() {
        int cpuCores = Runtime.getRuntime().availableProcessors();
        int suggestedPoolSize = cpuCores * 2 + 1;  // 基础公式

        // 考虑应用类型调整
        String appType = System.getProperty(“app.type“, “web“);
        if (“batch“.equals(appType)) {
            suggestedPoolSize = Math.min(suggestedPoolSize, 10);  // 批处理连接数较少
        } else if (“api“.equals(appType)) {
            suggestedPoolSize = Math.min(suggestedPoolSize, 50);  // API服务中等
        }

        return Math.max(10, Math.min(suggestedPoolSize, 100));  // 限制在10-100之间
    }
}
连接泄漏排查
连接未正确关闭是导致池子耗尽的常见元凶。这通常源于代码编写疏忽或异常处理不当。
1. 连接泄漏常见原因
下面的代码片段列举了几种典型的连接泄漏场景:
@Service
public class ConnectionLeakExamples {

    // 1. 未关闭连接
    @Autowired
    private JdbcTemplate jdbcTemplate;

    public void leakExample1() {
        // ❌ 错误:获取连接后未关闭
        Connection conn = dataSource.getConnection();
        Statement stmt = conn.createStatement();
        ResultSet rs = stmt.executeQuery(“SELECT * FROM users“);
        // 忘记关闭 conn, stmt, rs
    }

    // 2. 异常情况下未关闭
    public void leakExample2() throws SQLException {
        Connection conn = null;
        try {
            conn = dataSource.getConnection();
            // 业务操作
            if (someCondition) {
                throw new RuntimeException(“业务异常“);
            }
            // 正常关闭
            conn.close();
        } catch (Exception e) {
            // ❌ 异常时未关闭连接
            throw e;
        }
    }

    // 3. Spring事务传播问题
    @Transactional
    public void leakExample3() {
        // 如果方法内部再获取新连接
        Connection conn = dataSource.getConnection();  // 新连接,不受事务管理
        // 使用后未关闭
    }

    // 4. ThreadLocal未清理
    private static final ThreadLocal<Connection> connectionHolder =
new ThreadLocal<>();

    public void leakExample4() {
        Connection conn = connectionHolder.get();
        if (conn == null) {
            conn = dataSource.getConnection();
            connectionHolder.set(conn);
        }
        // 使用后未清理,线程池复用导致连接泄漏
    }

    // 5. 连接池配置不当
    public void leakExample5() {
        // 连接池泄漏检测阈值设置过大
        // hikari.leak-detection-threshold=60000 (1分钟)
        // 应该设置为更小的值,如10秒
    }
}
2. 连接泄漏检测工具
被动等待报错不如主动监控。我们可以实现一个监控组件,定期检查连接池状态和可疑线程。
@Component
@Slf4j
public class ConnectionLeakDetector {

    @Autowired
    private DataSource dataSource;

    private final ScheduledExecutorService scheduler =
        Executors.newScheduledThreadPool(1);

    @PostConstruct
    public void startMonitoring() {
        scheduler.scheduleAtFixedRate(() -> {
            try {
                monitorConnectionLeaks();
                monitorPoolStats();
                checkLongRunningConnections();
            } catch (Exception e) {
                log.error(“连接泄漏监控异常“, e);
            }
        }, 0, 30, TimeUnit.SECONDS);
    }

    private void monitorConnectionLeaks() {
        // 根据连接池类型检测
        if (dataSource instanceof HikariDataSource) {
            monitorHikariLeaks();
        } else if (dataSource instanceof DruidDataSource) {
            monitorDruidLeaks();
        }
    }

    private void monitorHikariLeaks() {
        HikariDataSource hikari = (HikariDataSource) dataSource;
        HikariPoolMXBean pool = hikari.getHikariPoolMXBean();

        // 获取连接池统计
        int activeConnections = pool.getActiveConnections();
        int idleConnections = pool.getIdleConnections();
        int totalConnections = pool.getTotalConnections();
        int threadsAwaiting = pool.getThreadsAwaitingConnection();

        log.debug(“Hikari状态 - 活跃: {}, 空闲: {}, 总数: {}, 等待: {}“,
            activeConnections, idleConnections, totalConnections, threadsAwaiting);

        // 检测泄漏:活跃连接接近最大值且有空闲连接等待
        if (activeConnections >= hikari.getMaximumPoolSize() * 0.9 && threadsAwaiting > 0) {
            log.warn(“⚠️ 连接池可能泄漏 - 活跃连接数接近最大值“);

            // 记录泄漏嫌疑线程
            dumpConnectionLeakSuspects();
        }

        // 检查连接获取时间
        checkConnectionAcquisitionTime();
    }

    private void monitorDruidLeaks() {
        DruidDataSource druid = (DruidDataSource) dataSource;

        int activeCount = druid.getActiveCount();
        int poolingCount = druid.getPoolingCount();
        int maxActive = druid.getMaxActive();

        log.debug(“Druid状态 - 活跃: {}, 池中: {}, 最大: {}“,
            activeCount, poolingCount, maxActive);

        if (activeCount >= maxActive * 0.9) {
            log.warn(“⚠️ Druid连接池接近饱和 - 活跃: {}/{}“, activeCount, maxActive);
        }
    }

    private void dumpConnectionLeakSuspects() {
        // 获取当前所有线程的堆栈
        Map<Thread, StackTraceElement[]> allThreads = Thread.getAllStackTraces();

        // 分析可能持有连接的线程
        for (Map.Entry<Thread, StackTraceElement[]> entry : allThreads.entrySet()) {
            Thread thread = entry.getKey();
            StackTraceElement[] stackTrace = entry.getValue();

            // 检查堆栈中是否有数据库操作
            boolean hasDbOperation = false;
            for (StackTraceElement element : stackTrace) {
                if (element.getClassName().contains(“jdbc“) ||
                    element.getClassName().contains(“sql“) ||
                    element.getMethodName().contains(“execute“)) {
                    hasDbOperation = true;
                    break;
                }
            }

            if (hasDbOperation && thread.getState() != Thread.State.WAITING) {
                log.warn(“可能持有数据库连接的线程: {}, 状态: {}“,
                    thread.getName(), thread.getState());

                // 记录堆栈信息
                StringBuilder stack = new StringBuilder();
                for (StackTraceElement element : stackTrace) {
                    stack.append(“\n    “).append(element);
                }
                log.debug(“堆栈信息: {}“, stack.toString());
            }
        }
    }

    private void checkConnectionAcquisitionTime() {
        // 模拟测试连接获取时间
        long startTime = System.currentTimeMillis();

        try (Connection conn = dataSource.getConnection()) {
            long cost = System.currentTimeMillis() - startTime;

            if (cost > 1000) {  // 获取连接超过1秒
                log.warn(“获取连接耗时过长: {}ms“, cost);
            }
        } catch (SQLException e) {
            log.error(“测试获取连接失败“, e);
        }
    }

    private void checkLongRunningConnections() {
        // 查询长时间运行的连接
        try (Connection conn = dataSource.getConnection()) {
            String sql = “SELECT “ +
“p.ID as thread_id, “ +
“p.USER, “ +
“p.HOST, “ +
“p.DB, “ +
“p.COMMAND, “ +
“p.TIME as execution_time, “ +
“p.STATE, “ +
“LEFT(p.INFO, 200) as query “ +
“FROM information_schema.PROCESSLIST p “ +
“WHERE p.TIME > 60 “ +  // 执行超过60秒
“AND p.USER NOT IN (‘system user’, ‘event_scheduler’) “ +
“ORDER BY p.TIME DESC “ +
“LIMIT 10“;

            try (Statement stmt = conn.createStatement();
                 ResultSet rs = stmt.executeQuery(sql)) {

                List<String> longRunningQueries = new ArrayList<>();
                while (rs.next()) {
                    String info = String.format(
“线程ID: %s, 用户: %s, 执行时间: %ss, SQL: %s“,
                        rs.getString(“thread_id“),
                        rs.getString(“USER“),
                        rs.getString(“execution_time“),
                        rs.getString(“query“)
                    );
                    longRunningQueries.add(info);
                }

                if (!longRunningQueries.isEmpty()) {
                    log.warn(“检测到长时间运行的查询:\n{}“,
                        String.join(“\n“, longRunningQueries));
                }
            }
        } catch (SQLException e) {
            log.error(“检查长时间运行连接失败“, e);
        }
    }
}
慢查询导致的连接占用
一个执行缓慢的 SQL 会长时间占用数据库连接,导致其他请求排队等待,从而迅速耗尽连接池。
1. 慢查询检测与分析
我们可以实现一个定时任务,定期分析慢查询日志或 performance_schema 中的数据。
@Component
@Slf4j
public class SlowQueryAnalyzer {

    @Autowired
    private DataSource dataSource;

    /**
     * 监控和分析慢查询
     */
    @Scheduled(fixedDelay = 60000)  // 每分钟检查一次
    public void analyzeSlowQueries() {
        try (Connection conn = dataSource.getConnection()) {
            // 1. 检查慢查询日志配置
            checkSlowQueryConfig(conn);

            // 2. 获取当前慢查询
            List<SlowQuery> slowQueries = getCurrentSlowQueries(conn);

            // 3. 分析慢查询影响
            analyzeSlowQueryImpact(slowQueries);

            // 4. 自动优化建议
            generateOptimizationSuggestions(slowQueries);

        } catch (SQLException e) {
            log.error(“慢查询分析失败“, e);
        }
    }

    private void checkSlowQueryConfig(Connection conn) throws SQLException {
        String sql = “SHOW VARIABLES LIKE ‘slow_query%’“;
        try (Statement stmt = conn.createStatement();
             ResultSet rs = stmt.executeQuery(sql)) {

            Map<String, String> configs = new HashMap<>();
            while (rs.next()) {
                configs.put(rs.getString(1), rs.getString(2));
            }

            if (!“ON“.equals(configs.get(“slow_query_log“))) {
                log.warn(“慢查询日志未开启,建议开启以便分析“);
            }

            long longQueryTime = Long.parseLong(configs.getOrDefault(“long_query_time“, “10“));
            if (longQueryTime > 2) {
                log.warn(“慢查询阈值设置过高({}秒),建议调整为1-2秒“, longQueryTime);
            }
        }
    }

    private List<SlowQuery> getCurrentSlowQueries(Connection conn) throws SQLException {
        List<SlowQuery> queries = new ArrayList<>();

        // 从information_schema获取慢查询
        String sql = “SELECT “ +
“THREAD_ID, “ +
“SQL_TEXT, “ +
“ROWS_EXAMINED, “ +
“ROWS_SENT, “ +
“CREATED_TMP_TABLES, “ +
“CREATED_TMP_DISK_TABLES, “ +
“SELECT_SCAN, “ +
“SORT_ROWS, “ +
“NO_INDEX_USED, “ +
“NO_GOOD_INDEX_USED “ +
“FROM performance_schema.events_statements_history_long “ +
“WHERE TIMER_WAIT > 1000000000 “ +  // 执行时间>1秒
“ORDER BY TIMER_WAIT DESC “ +
“LIMIT 20“;

        try (Statement stmt = conn.createStatement();
             ResultSet rs = stmt.executeQuery(sql)) {

            while (rs.next()) {
                SlowQuery query = new SlowQuery();
                query.setThreadId(rs.getLong(“THREAD_ID“));
                query.setSqlText(rs.getString(“SQL_TEXT“));
                query.setRowsExamined(rs.getLong(“ROWS_EXAMINED“));
                query.setRowsSent(rs.getLong(“ROWS_SENT“));
                query.setCreatedTmpTables(rs.getInt(“CREATED_TMP_TABLES“));
                query.setCreatedTmpDiskTables(rs.getInt(“CREATED_TMP_DISK_TABLES“));
                query.setSelectScan(rs.getInt(“SELECT_SCAN“));
                query.setSortRows(rs.getLong(“SORT_ROWS“));
                query.setNoIndexUsed(rs.getInt(“NO_INDEX_USED“));
                query.setNoGoodIndexUsed(rs.getInt(“NO_GOOD_INDEX_USED“));
                queries.add(query);
            }
        }

        return queries;
    }

    private void analyzeSlowQueryImpact(List<SlowQuery> slowQueries) {
        if (slowQueries.isEmpty()) {
            return;
        }

        log.warn(“检测到 {} 个慢查询“, slowQueries.size());

        for (SlowQuery query : slowQueries) {
            // 分析问题类型
            StringBuilder analysis = new StringBuilder();

            if (query.getRowsExamined() > 10000) {
                analysis.append(“扫描行数过多(“).append(query.getRowsExamined()).append(“行) “);
            }

            if (query.getNoIndexUsed() == 1) {
                analysis.append(“未使用索引 “);
            }

            if (query.getCreatedTmpDiskTables() > 0) {
                analysis.append(“使用了磁盘临时表 “);
            }

            if (query.getSelectScan() > 0) {
                analysis.append(“全表扫描 “);
            }

            if (query.getSortRows() > 1000) {
                analysis.append(“排序行数过多(“).append(query.getSortRows()).append(“行) “);
            }

            if (analysis.length() > 0) {
                log.warn(“慢查询分析 - SQL: {}…, 问题: {}“,
                    query.getSqlText().substring(0, Math.min(100, query.getSqlText().length())),
                    analysis.toString());
            }
        }
    }

    private void generateOptimizationSuggestions(List<SlowQuery> slowQueries) {
        // 生成索引优化建议
        Set<String> tablesNeedingIndex = new HashSet<>();

        for (SlowQuery query : slowQueries) {
            if (query.getNoIndexUsed() == 1 || query.getSelectScan() > 0) {
                // 提取表名(简化版)
                String sql = query.getSqlText().toLowerCase();
                if (sql.contains(“from “)) {
                    String afterFrom = sql.substring(sql.indexOf(“from “) + 5);
                    String tableName = afterFrom.split(“[\\s,;]“)[0];
                    tablesNeedingIndex.add(tableName);
                }
            }
        }

        if (!tablesNeedingIndex.isEmpty()) {
            log.info(“索引优化建议: 考虑为以下表添加索引 - {}“,
                String.join(“, “, tablesNeedingIndex));
        }
    }

    @Data
    private static class SlowQuery {
        private long threadId;
        private String sqlText;
        private long rowsExamined;
        private long rowsSent;
        private int createdTmpTables;
        private int createdTmpDiskTables;
        private int selectScan;
        private long sortRows;
        private int noIndexUsed;
        private int noGoodIndexUsed;
    }
}
2. 查询超时控制
为查询设置超时是防止单个慢查询拖垮整个池子的有效手段。你可以在不同层面进行配置。
@Configuration
public class QueryTimeoutConfig {

    @Bean
    public JdbcTemplate jdbcTemplate(DataSource dataSource) {
        JdbcTemplate jdbcTemplate = new JdbcTemplate(dataSource);

        // 设置查询超时
        jdbcTemplate.setQueryTimeout(30);  // 30秒超时

        return jdbcTemplate;
    }

    @Bean
    public PlatformTransactionManager transactionManager(DataSource dataSource) {
        DataSourceTransactionManager txManager = new DataSourceTransactionManager(dataSource);
        txManager.setDefaultTimeout(60);  // 事务默认60秒超时
        return txManager;
    }

    /**
     * MyBatis拦截器设置查询超时
     */
    @Bean
    public ConfigurationCustomizer mybatisConfigurationCustomizer() {
        return configuration -> {
            configuration.setDefaultStatementTimeout(30);  // SQL语句30秒超时
        };
    }

    /**
     * 自定义Statement拦截器
     */
    @Bean
    public StatementInterceptor statementInterceptor() {
        return new StatementInterceptor();
    }

    @Intercepts({
        @Signature(type = StatementHandler.class, method = “prepare“,
                  args = {Connection.class, Integer.class})
    })
    public static class StatementInterceptor implements Interceptor {

        @Override
        public Object intercept(Invocation invocation) throws Throwable {
            StatementHandler handler = (StatementHandler) invocation.getTarget();

            // 设置查询超时
            if (handler.getBoundSql().getSql().toLowerCase().contains(“select“)) {
                MetaObject metaObject = SystemMetaObject.forObject(handler);
                metaObject.setValue(“queryTimeout“, 30);  // 30秒
            }

            return invocation.proceed();
        }
    }
}
数据库层面优化
有时问题根源在数据库本身。优化数据库参数和连接管理能从根源上缓解压力。
1. MySQL参数调优
调整 MySQL 服务器的配置,确保其能够处理应用所需的连接数。
-- 连接相关参数优化
-- 在my.cnf中配置
/*
[mysqld]
# 最大连接数(根据服务器内存调整,通常1000-5000)
max_connections = 1000

# 连接超时时间
wait_timeout = 600        # 非交互连接超时600秒
interactive_timeout = 600  # 交互连接超时600秒

# 连接缓冲
thread_cache_size = 100   # 线程缓存大小
back_log = 500            # 连接等待队列

# 连接限制
max_connect_errors = 100  # 最大连接错误数
max_user_connections = 0  # 每个用户最大连接数,0表示不限制

# 内存相关
max_allowed_packet = 64M  # 最大包大小
tmp_table_size = 64M      # 临时表大小
max_heap_table_size = 64M # 内存表大小

# InnoDB缓冲池(重要!)
innodb_buffer_pool_size = 4G  # 设置为物理内存的70-80%
innodb_log_file_size = 1G
innodb_flush_log_at_trx_commit = 2  # 性能与安全的平衡
*/

-- 动态调整参数示例
SET GLOBAL max_connections = 1000;
SET GLOBAL wait_timeout = 600;
SET GLOBAL thread_cache_size = 100;

-- 监控连接使用情况
SHOW STATUS LIKE ‘Threads_%’;
SHOW STATUS LIKE ‘Connections’;
SHOW STATUS LIKE ‘Aborted_connects’;
SHOW STATUS LIKE ‘Max_used_connections’;
2. 应用层连接限制与健康检查
除了配置数据库,在应用层实施连接限制和健康检查也是一种防御性策略。
@Component
@Slf4j
public class ConnectionLimiter {

    @Autowired
    private DataSource dataSource;

    private final Semaphore connectionSemaphore;
    private final int maxConcurrentQueries;

    public ConnectionLimiter() {
        // 根据CPU核心数设置并发限制
        this.maxConcurrentQueries = Runtime.getRuntime().availableProcessors() * 4;
        this.connectionSemaphore = new Semaphore(maxConcurrentQueries);

        log.info(“连接限制器初始化,最大并发查询数: {}“, maxConcurrentQueries);
    }

    /**
     * 带限流的数据库操作
     */
    public <T> T executeWithLimit(Callable<T> task) throws Exception {
        if (!connectionSemaphore.tryAcquire(30, TimeUnit.SECONDS)) {
            throw new RuntimeException(“获取连接许可超时,当前并发过高“);
        }

        try {
            long startTime = System.currentTimeMillis();
            T result = task.call();
            long cost = System.currentTimeMillis() - startTime;

            if (cost > 5000) {  // 操作超过5秒
                log.warn(“数据库操作耗时过长: {}ms“, cost);
            }

            return result;
        } finally {
            connectionSemaphore.release();

            // 监控信号量状态
            int available = connectionSemaphore.availablePermits();
            if (available < maxConcurrentQueries * 0.2) {
                log.warn(“数据库连接并发较高,可用许可: {}/{}“,
                    available, maxConcurrentQueries);
            }
        }
    }

    /**
     * 连接健康检查
     */
    public boolean isConnectionHealthy(Connection conn) {
        try {
            // 简单健康检查
            return conn.isValid(5);  // 5秒超时
        } catch (SQLException e) {
            log.error(“连接健康检查失败“, e);
            return false;
        }
    }

    /**
     * 监控连接池状态
     */
    @Scheduled(fixedRate = 60000)
    public void monitorConnectionPool() {
        try (Connection conn = dataSource.getConnection()) {
            String sql = “SHOW STATUS WHERE Variable_name IN (“ +
“‘Threads_connected’, “ +
“‘Threads_running’, “ +
“‘Max_used_connections’, “ +
“‘Aborted_connects’, “ +
“‘Connection_errors_max_connections’)“;

            try (Statement stmt = conn.createStatement();
                 ResultSet rs = stmt.executeQuery(sql)) {

                Map<String, Long> stats = new HashMap<>();
                while (rs.next()) {
                    stats.put(rs.getString(1), rs.getLong(2));
                }

                long threadsConnected = stats.getOrDefault(“Threads_connected“, 0L);
                long threadsRunning = stats.getOrDefault(“Threads_running“, 0L);
                long maxUsed = stats.getOrDefault(“Max_used_connections“, 0L);

                log.info(“连接池监控 - 当前连接: {}, 运行中: {}, 历史最大: {}“,
                    threadsConnected, threadsRunning, maxUsed);

                // 告警逻辑
                if (threadsRunning > 100) {
                    log.warn(“数据库并发过高,运行中线程: {}“, threadsRunning);
                }

                if (stats.containsKey(“Connection_errors_max_connections“)) {
                    long errors = stats.get(“Connection_errors_max_connections“);
                    if (errors > 0) {
                        log.error(“达到最大连接数限制,错误次数: {}“, errors);
                    }
                }
            }
        } catch (SQLException e) {
            log.error(“监控连接池失败“, e);
        }
    }
}
应用架构优化
当单库连接池成为瓶颈时,可能需要从架构层面进行优化,例如引入读写分离、连接池分层或异步处理。
1. 连接池分层设计(读写分离)
为读操作和写操作配置独立的连接池,可以有效分散压力。
@Configuration
@Slf4j
public class MultiLayerConnectionPool {

    /**
     * 主库连接池(写操作)
     */
    @Bean(name = “masterDataSource“)
    @Primary
    public DataSource masterDataSource() {
        HikariConfig config = new HikariConfig();
        config.setPoolName(“MasterPool“);
        config.setJdbcUrl(“jdbc:mysql://master-host:3306/db“);
        config.setUsername(“user“);
        config.setPassword(“password“);
        config.setMaximumPoolSize(20);  // 写操作较少,连接数可以较少
        config.setConnectionTimeout(30000);
        config.setIdleTimeout(600000);
        config.setMaxLifetime(1800000);
        config.setReadOnly(false);
        return new HikariDataSource(config);
    }

    /**
     * 从库连接池(读操作)
     */
    @Bean(name = “slaveDataSource“)
    public DataSource slaveDataSource() {
        HikariConfig config = new HikariConfig();
        config.setPoolName(“SlavePool“);
        config.setJdbcUrl(“jdbc:mysql://slave-host:3306/db“);
        config.setUsername(“user“);
        config.setPassword(“password“);
        config.setMaximumPoolSize(50);  // 读操作较多,连接数可以较多
        config.setConnectionTimeout(30000);
        config.setIdleTimeout(600000);
        config.setMaxLifetime(1800000);
        config.setReadOnly(true);  // 设置为只读
        return new HikariDataSource(config);
    }

    /**
     * 动态数据源路由
     */
    @Bean
    public DataSource routingDataSource(
        @Qualifier(“masterDataSource“) DataSource master,
        @Qualifier(“slaveDataSource“) DataSource slave) {

        Map<Object, Object> targetDataSources = new HashMap<>();
        targetDataSources.put(“master“, master);
        targetDataSources.put(“slave“, slave);

        RoutingDataSource routingDataSource = new RoutingDataSource();
        routingDataSource.setDefaultTargetDataSource(master);
        routingDataSource.setTargetDataSources(targetDataSources);

        return routingDataSource;
    }

    /**
     * 自定义数据源路由
     */
    public static class RoutingDataSource extends AbstractRoutingDataSource {

        @Override
        protected Object determineCurrentLookupKey() {
            // 根据上下文决定使用主库还是从库
            boolean isReadOnly = TransactionSynchronizationManager.isCurrentTransactionReadOnly();
            boolean isWriteOperation = TransactionSynchronizationManager.isActualTransactionActive() &&
                                      !TransactionSynchronizationManager.isCurrentTransactionReadOnly();

            if (isWriteOperation) {
                return “master“;
            } else if (isReadOnly) {
                return “slave“;
            } else {
                // 非事务操作,根据方法名判断
                String methodName = getCurrentMethodName();
                if (methodName != null && methodName.startsWith(“find“) ||
                    methodName.startsWith(“query“) || methodName.startsWith(“select“)) {
                    return “slave“;
                }
                return “master“;
            }
        }

        private String getCurrentMethodName() {
            StackTraceElement[] stackTrace = Thread.currentThread().getStackTrace();
            for (StackTraceElement element : stackTrace) {
                if (!element.getClassName().equals(RoutingDataSource.class.getName()) &&
                    !element.getClassName().equals(Thread.class.getName())) {
                    return element.getMethodName();
                }
            }
            return null;
        }
    }
}
应急处理方案
当线上问题真的发生时,需要一个清晰的应急清单和自动化脚本来快速止血。
1. 连接池爆满应急清单
## 数据库连接池爆满应急响应清单

### 第一阶段:紧急止血(0-5分钟)
- [ ] 确认告警真实性,查看监控指标
- [ ] 判断影响范围(单个应用还是整个系统)
- [ ] 快速重启受影响最严重的应用实例
- [ ] 负载均衡摘除故障节点
- [ ] 临时扩容数据库连接数
```sql
  SET GLOBAL max_connections = 2000;  -- 临时增加
第二阶段:问题定位(5-15分钟)
-- 查看连接来源
SELECT USER, HOST, COUNT(*) as connections
FROM information_schema.processlist
GROUP BY USER, HOST
ORDER BY connections DESC;
-- 查看长时间运行的查询
SELECT * FROM information_schema.processlist
WHERE TIME > 60
ORDER BY TIME DESC;
  - 连接泄漏日志
  - 慢查询日志
  - 线程堆栈信息

### 第三阶段:临时解决(15-30分钟)
1. **清理无效连接**:
```sql
-- 杀死空闲时间过长的连接
SELECT GROUP_CONCAT(CONCAT(‘KILL ‘, ID, ‘;‘))
FROM information_schema.processlist
WHERE COMMAND = ‘Sleep‘ AND TIME > 600;
- 调整应用配置 (临时):
# 临时增加最大连接数
spring.datasource.hikari.maximum-pool-size: 100
减少连接超时时间
spring.datasource.hikari.connection-timeout: 10000
启用连接泄漏检测
spring.datasource.hikari.leak-detection-threshold: 10000
3. **重启连接池**:
```java
// 通过API重启连接池
((HikariDataSource) dataSource).softEvictConnections();
第四阶段:根因修复(30-60分钟)
- 修复连接泄漏代码
- 优化慢查询SQL
- 调整永久配置参数
- 架构优化(如引入缓存、读写分离)
第五阶段:验证复盘(事后)
- 验证修复效果
- 复盘根本原因
- 更新应急预案
- 完善监控告警
2. 自动化应急处理脚本
一个自动化的脚本可以帮你快速执行诊断和初步修复动作(使用前请务必在测试环境验证,并理解每一步的作用)。
#!/bin/bash
# connection_pool_emergency.sh

DB_HOST=“localhost“
DB_PORT=“3306“
DB_USER=“root“
DB_PASS=“password“
THRESHOLD=80  # 连接使用率阈值

echo “开始数据库连接池应急处理…“
echo “时间: $(date)“
echo “数据库: ${DB_HOST}:${DB_PORT}“

# 1. 检查连接使用率
MAX_CONN=$(mysql -h $DB_HOST -P $DB_PORT -u $DB_USER -p$DB_PASS -sN -e \
“SHOW VARIABLES LIKE ‘max_connections’“ | awk ‘{print $2}’)
CURR_CONN=$(mysql -h $DB_HOST -P $DB_PORT -u $DB_USER -p$DB_PASS -sN -e \
“SHOW STATUS LIKE ‘Threads_connected’“ | awk ‘{print $2}’)

USAGE_RATE=$((CURR_CONN * 100 / MAX_CONN))

echo “连接使用率: ${CURR_CONN}/${MAX_CONN} (${USAGE_RATE}%)“

if [ “$USAGE_RATE“ -lt “$THRESHOLD“ ]; then
echo “连接使用率正常,无需处理“
exit 0
fi

echo “⚠️ 连接使用率超过${THRESHOLD}%,开始应急处理…“

# 2. 分析连接情况
echo -e “\n分析连接情况…“
mysql -h $DB_HOST -P $DB_PORT -u $DB_USER -p$DB_PASS -e “
-- 按用户统计连接数
SELECT
    USER,
    COUNT(*) as connections,
    GROUP_CONCAT(DISTINCT HOST) as hosts,
    MAX(TIME) as max_time
FROM information_schema.processlist
GROUP BY USER
ORDER BY connections DESC;

-- 查看长时间空闲连接
SELECT
    ID,
    USER,
    HOST,
    DB,
    TIME,
    STATE,
    LEFT(INFO, 100) as query
FROM information_schema.processlist
WHERE COMMAND = ‘Sleep‘ AND TIME > 300
ORDER BY TIME DESC
LIMIT 10;

-- 查看运行时间长的查询
SELECT
    ID,
    USER,
    TIME,
    STATE,
    LEFT(INFO, 200) as query
FROM information_schema.processlist
WHERE TIME > 30 AND COMMAND != ‘Sleep‘
ORDER BY TIME DESC
LIMIT 10;
“

# 3. 清理无效连接(谨慎操作)
read -p “是否清理空闲超过10分钟的连接?(y/n): “ -n 1 -r
echo
if [[ $REPLY =~ ^[Yy]$ ]]; then
echo “清理空闲连接…“
    mysql -h $DB_HOST -P $DB_PORT -u $DB_USER -p$DB_PASS -e “
    SELECT CONCAT(‘KILL ‘, ID, ‘;‘) as kill_command
    FROM information_schema.processlist
    WHERE COMMAND = ‘Sleep‘ AND TIME > 600 AND USER NOT IN (‘system user’, ‘event_scheduler’)
    INTO OUTFILE ‘/tmp/kill_commands.sql‘;

    SOURCE /tmp/kill_commands.sql;
    “
echo “已清理长时间空闲连接“
fi

# 4. 临时调整参数
read -p “是否临时增加最大连接数?(y/n): “ -n 1 -r
echo
if [[ $REPLY =~ ^[Yy]$ ]]; then
    NEW_MAX=$((MAX_CONN * 120 / 100))  # 增加20%
echo “临时增加最大连接数到: ${NEW_MAX}“
    mysql -h $DB_HOST -P $DB_PORT -u $DB_USER -p$DB_PASS -e \
“SET GLOBAL max_connections = ${NEW_MAX};“
fi

# 5. 生成报告
REPORT_FILE=“/tmp/connection_emergency_$(date +%Y%m%d_%H%M%S).txt“

cat > $REPORT_FILE << EOF
# 数据库连接池应急处理报告
处理时间: $(date)
数据库: ${DB_HOST}:${DB_PORT}

## 处理前状态
- 最大连接数: ${MAX_CONN}
- 当前连接数: ${CURR_CONN}
- 使用率: ${USAGE_RATE}%

## 处理措施
$(if [[ $REPLY =~ ^[Yy]$ ]]; then echo “- 清理了空闲超过10分钟的连接“; fi)
$(if [[ $REPLY =~ ^[Yy]$ ]]; then echo “- 临时增加最大连接数到 ${NEW_MAX}“; fi)

## 建议后续优化
1. 检查应用连接泄漏
2. 优化慢查询SQL
3. 调整连接池配置
4. 考虑读写分离架构
EOF

echo “应急处理完成,报告已保存: ${REPORT_FILE}“
监控与告警体系
建立完善的监控是预防问题的关键。你应该监控连接池的使用率、等待线程数、获取连接时间等核心指标。
1. Prometheus 监控配置示例
# prometheus.yml
scrape_configs:
  - job_name: ‘spring-boot’
    metrics_path: ‘/actuator/prometheus’
    static_configs:
      - targets: [‘localhost:8080’]

  - job_name: ‘mysql’
    static_configs:
      - targets: [‘localhost:9104’]  # mysqld_exporter

# 告警规则
groups:
  - name: connection_pool_alerts
    rules:
      - alert: HighConnectionPoolUsage
        expr: hikaricp_connections_active / hikaricp_connections_max * 100 > 80
        for: 5m
        labels:
          severity: warning
        annotations:
          summary: “数据库连接池使用率过高“
          description: “实例 {{ $labels.instance }} 连接池使用率 {{ $value | humanizePercentage }}“

      - alert: ConnectionPoolExhausted
        expr: hikaricp_connections_max - hikaricp_connections_active < 5
        for: 2m
        labels:
          severity: critical
        annotations:
          summary: “数据库连接池即将耗尽“
          description: “实例 {{ $labels.instance }} 可用连接少于5个“

      - alert: HighConnectionWaitTime
        expr: rate(hikaricp_connections_acquired_seconds_sum[5m]) > 1
        for: 5m
        labels:
          severity: warning
        annotations:
          summary: “获取数据库连接等待时间过长“
          description: “实例 {{ $labels.instance }} 平均等待时间 {{ $value }}秒“

      - alert: MySQLHighConnections
        expr: mysql_global_status_threads_connected / mysql_global_variables_max_connections * 100 > 80
        for: 5m
        labels:
          severity: warning
        annotations:
          summary: “MySQL数据库连接数过高“
          description: “数据库 {{ $labels.instance }} 连接使用率 {{ $value | humanizePercentage }}“
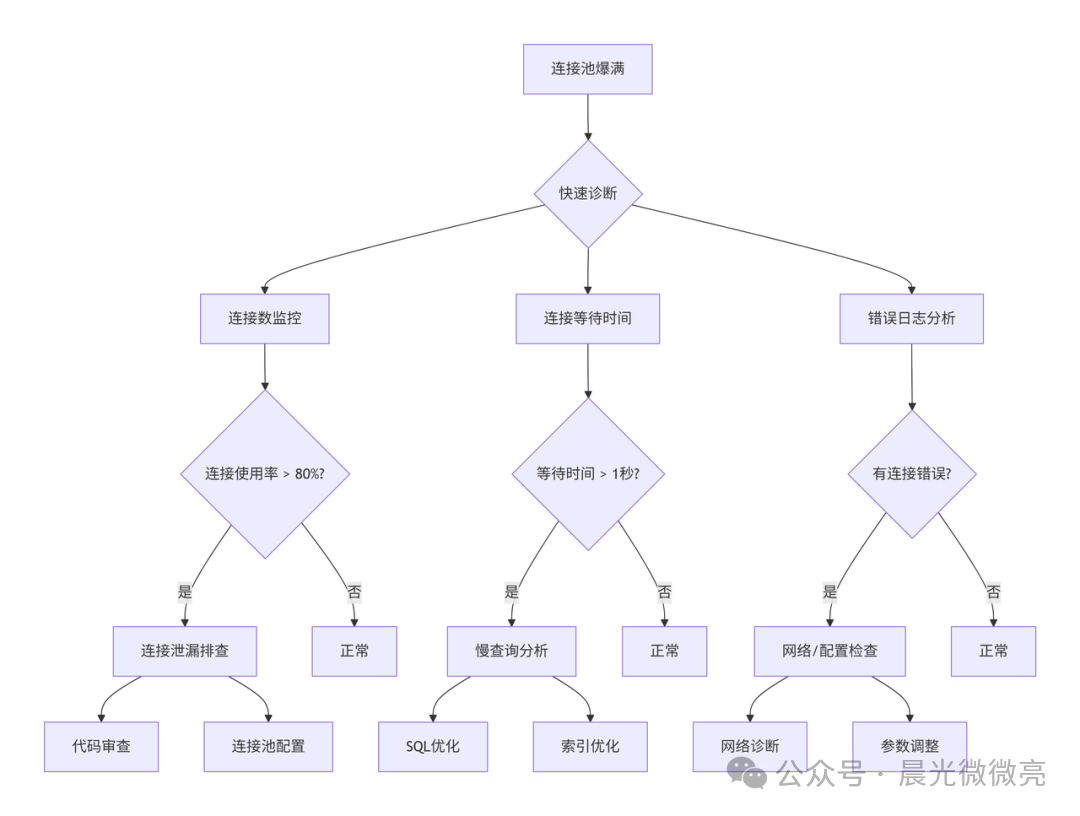
系统化排查流程
当面对连接池问题时,遵循一个清晰的排查路径可以事半功倍。下图概括了从发现问题到定位根因的核心思路:
总结与长期治理
连接池问题往往是系统深层问题的表象。根治它需要代码规范、合理配置、完善监控和架构优化的组合拳。建议你建立长期的治理路线图:
- 短期:建立监控告警,修复明显泄漏,制定应急预案。
- 中期:实现自动化容量规划,建立 SQL 审查和性能测试体系。
- 长期:优化数据库架构,实现智能连接池管理,形成规范化运维体系。
记住,预防远比补救成本更低。通过持续监控、定期优化和经验沉淀,你可以让数据库连接池这个基础设施组件变得稳固而可靠。
如果你想深入探讨更多关于 Java 性能优化或 MySQL 的实战技巧,欢迎来 云栈社区 与更多开发者交流。
 发表于 2026-1-19 13:59:58
|
查看: 194|
回复: 0
发表于 2026-1-19 13:59:58
|
查看: 194|
回复: 0
