Go语言内置的 testing 包为开发者提供了强大的基准测试(Benchmark)能力。你是否曾好奇,一句简单的 go test -bench=. 背后,框架是如何精确地统计耗时与内存分配的?本文将深入 src/testing/benchmark.go 源码,剖析 B 结构体的设计、核心计时函数的工作原理以及最终性能指标的计算过程。
1. 核心数据结构:B 结构体
源码位于 src/testing/benchmark.go,B 结构体承载了一次基准测试的所有状态。
type B struct {
 common
 importPath string // import path of the package containing the benchmark
 bstate *benchState
 N int
 previousN int // number of iterations in the previous run
 previousDuration time.Duration // total duration of the previous run
 benchFunc func(b *B)
 benchTime durationOrCountFlag
 bytes int64
 missingBytes bool // one of the subbenchmarks does not have bytes set.
 timerOn bool
 showAllocResult bool
 result BenchmarkResult
 parallelism int // RunParallel creates parallelism*GOMAXPROCS goroutines
 // The initial states of memStats.Mallocs and memStats.TotalAlloc.
 startAllocs uint64
 startBytes uint64
 // The net total of this test after being run.
 netAllocs uint64
 netBytes uint64
 // Extra metrics collected by ReportMetric.
 extra map[string]float64
 // For Loop() to be executed in benchFunc.
 // Loop() has its own control logic that skips the loop scaling.
 // See issue #61515.
 loopN int
}
这个结构体的字段可以归纳为以下几类:
1). 基础标识与调度
importPath: 测试所在包的导入路径。bstate: 基准测试的状态管理器。benchFunc: 用户编写的测试函数。
2). 循环控制
N: 当前轮次的循环执行次数,由框架自动调整。previousN: 上一轮运行的迭代次数。loopN: 供 b.Loop() 方法使用的专用循环计数器。
3). 耗时统计
benchTime: 测试目标耗时。控制基准测试运行的最小总耗时(默认为1秒,可通过 -benchtime 标志调整,如 -benchtime=5s 或 -benchtime=100x)。previousDuration: 上一轮运行的总耗时。timerOn: 计时器开关,标记当前是否正在统计耗时。
4). 内存与字节统计
bytes: 通过 SetBytes(n) 设置的、单次迭代处理的字节数。missingBytes: 标记子测试是否未设置字节数。startAllocs: 计时开始时内存分配次数的初始值。startBytes: 计时开始时内存分配字节数的初始值。netAllocs: 累计的总内存分配次数。netBytes: 累计的总内存分配字节数。
5). 并行控制
parallelism: 并行度,供 RunParallel 方法使用。
6). 结果与输出
result: 最终的基准测试结果。showAllocResult: 控制是否显示内存分配结果。extra: 存储用户通过 ReportMetric 注册的自定义指标。
7). 通用能力
common: 内嵌结构体,继承了通用测试能力(如日志、错误处理)。
2. 启动计时:B.StartTimer()
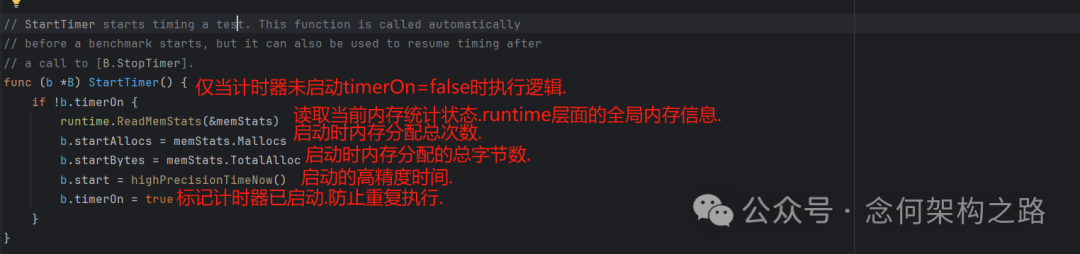
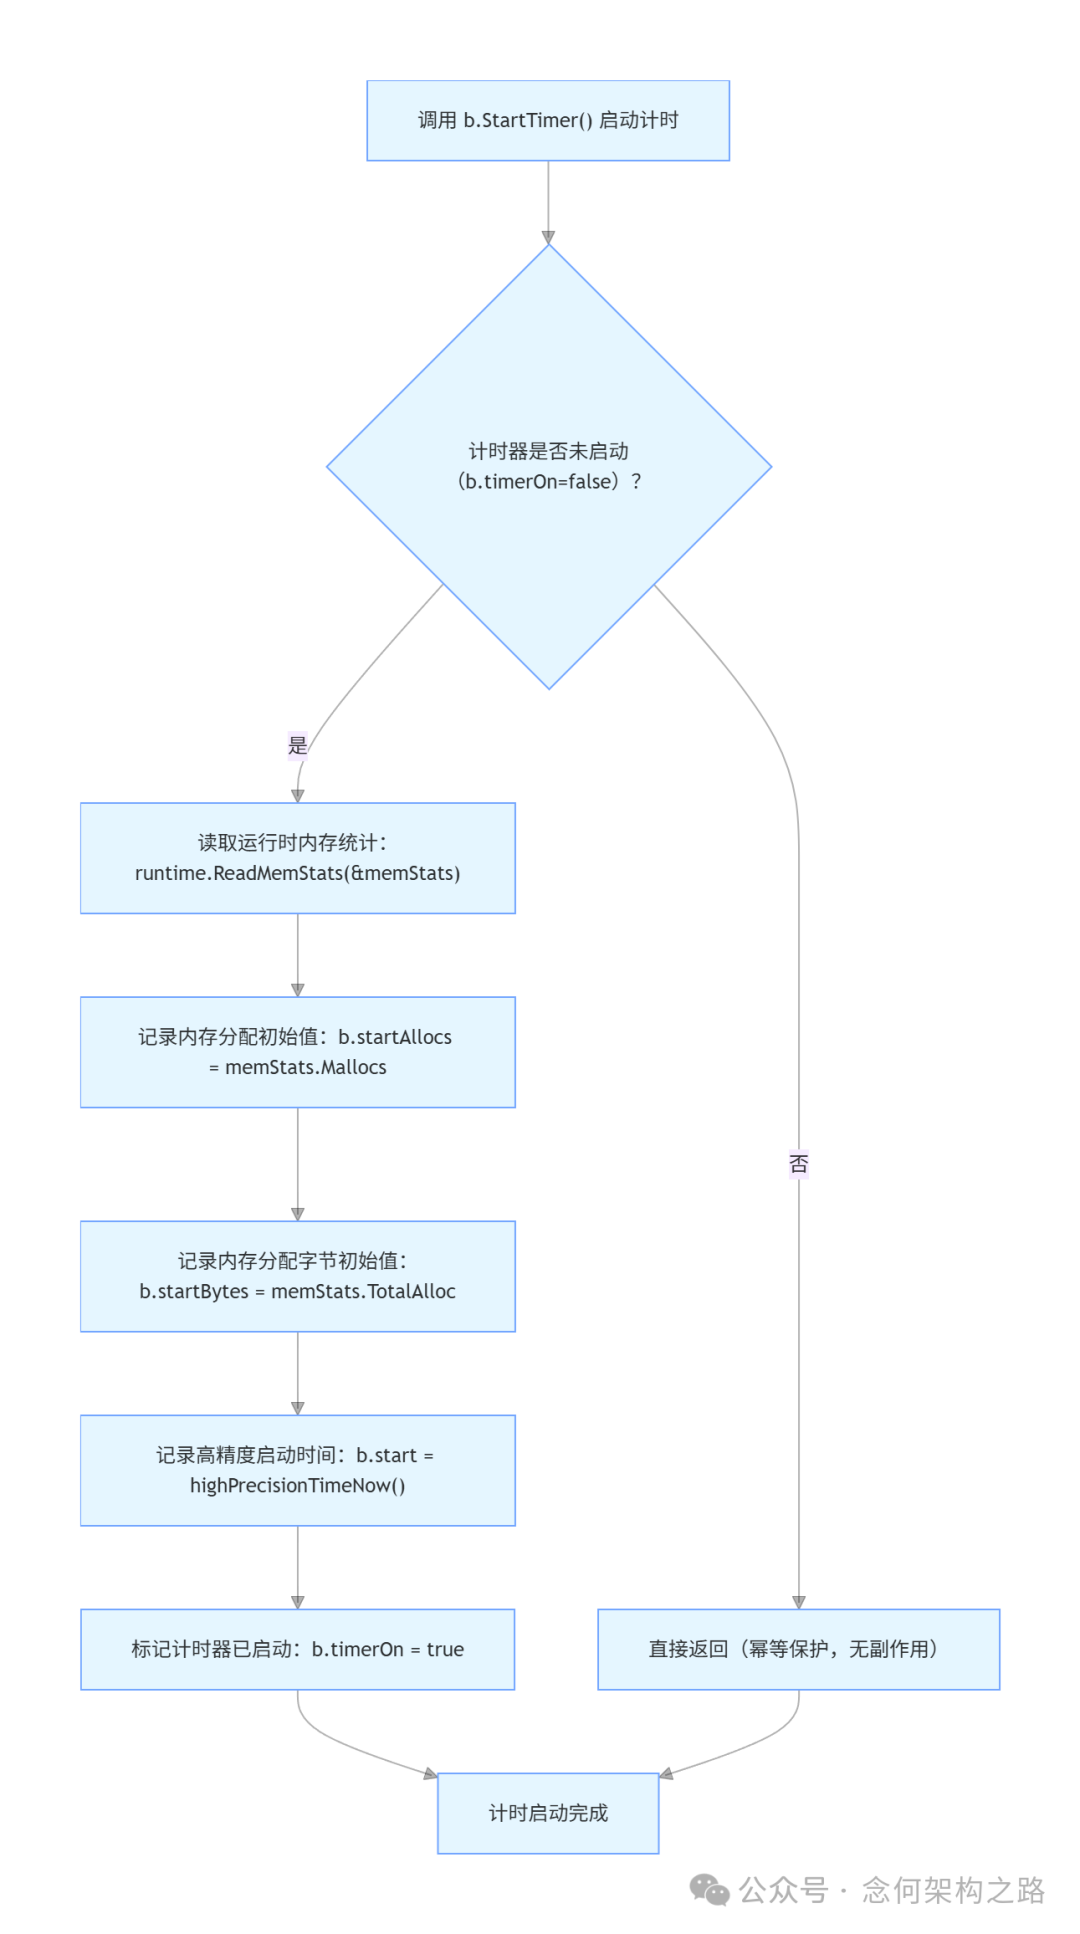
StartTimer() 函数负责启动计时并初始化内存统计的基准值。通常在测试执行时会自动调用,用户一般无需手动干预。
func (b *B) StartTimer() {
 if !b.timerOn {
  runtime.ReadMemStats(&memStats)
  b.startAllocs = memStats.Mallocs
  b.startBytes = memStats.TotalAlloc
  b.start = highPrecisionTimeNow()
  b.timerOn = true
 }
}
其逻辑是幂等的:仅当计时器未启动(timerOn=false)时才执行初始化逻辑。它会记录当前时刻的内存分配状态和高精度时间作为基准,然后将 timerOn 标记为 true。
逻辑流程图:
3. 停止计时:B.StopTimer()
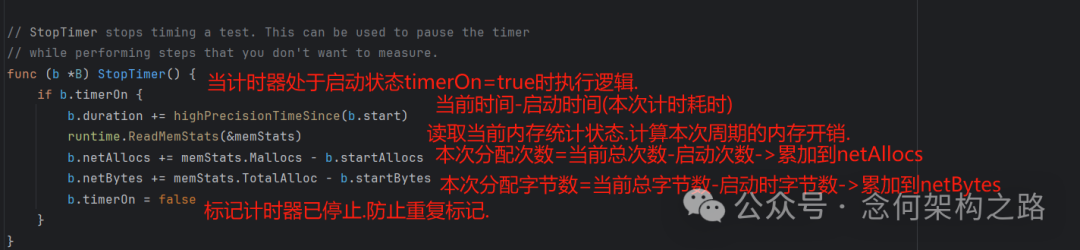
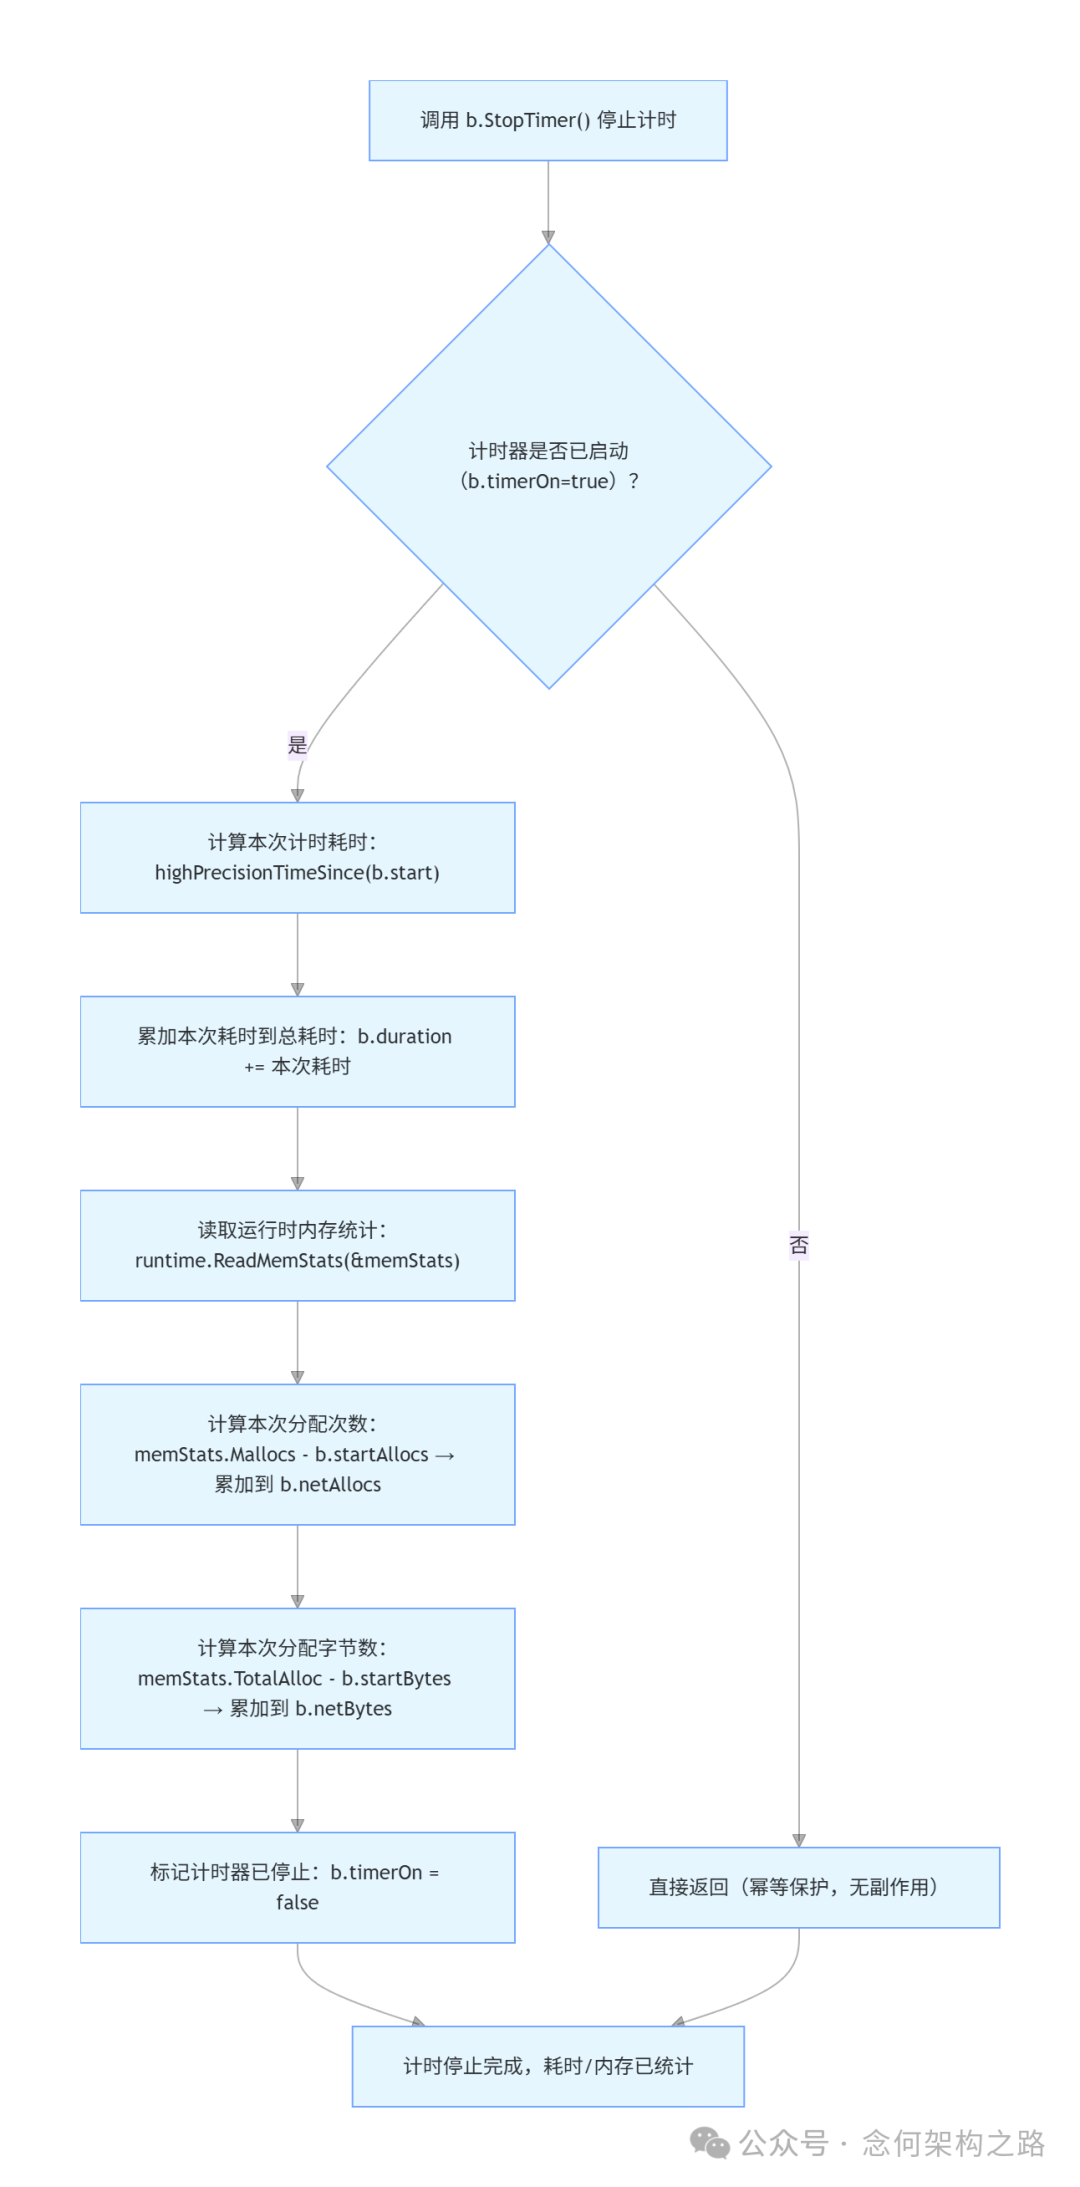
StopTimer() 负责停止计时,并累加本次计时周期内的耗时和内存开销到总统计值中。
// StopTimer stops timing a test. This can be used to pause the timer
// while performing steps that you don't want to measure.
func (b *B) StopTimer() {
 if b.timerOn {
  b.duration += highPrecisionTimeSince(b.start)
  runtime.ReadMemStats(&memStats)
  b.netAllocs += memStats.Mallocs - b.startAllocs
  b.netBytes += memStats.TotalAlloc - b.startBytes
  b.timerOn = false
 }
}
关键点在于,StopTimer() 不意味着测试结束。在一个复杂的测试函数中,你可以多次调用 StartTimer() 和 StopTimer() 来排除初始化等非核心操作的干扰,此时统计值(b.duration, b.netAllocs, b.netBytes)是多次累加的结果。
逻辑流程图:
4. 重置计时:B.ResetTimer()
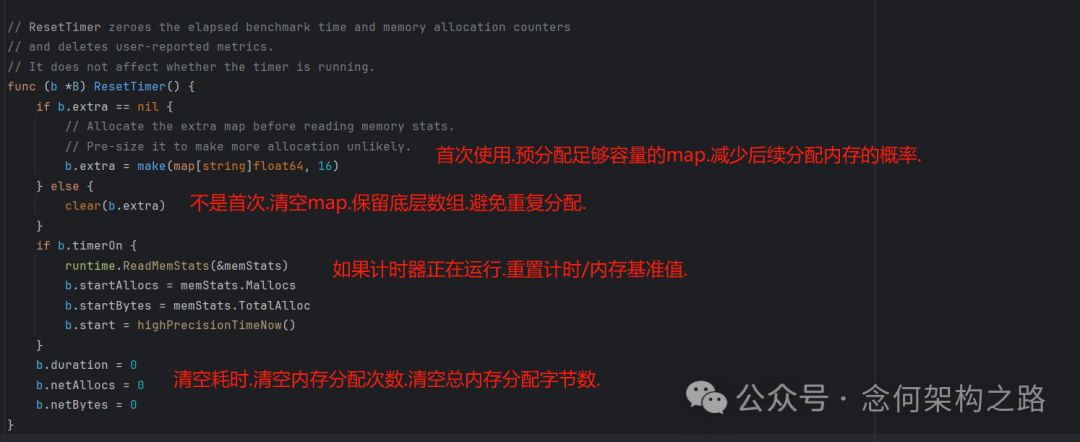
ResetTimer() 用于清零已累积的耗时和内存分配计数器,并清空用户自定义指标。它不影响计时器的运行状态。如果你在 benchFunc 开始前有大量初始化代码,通常会在初始化完成后调用一次此方法,避免初始化开销影响性能统计。
// ResetTimer zeroes the elapsed benchmark time and memory allocation counters
// and deletes user-reported metrics.
// It does not affect whether the timer is running.
func (b *B) ResetTimer() {
 if b.extra == nil {
  // Allocate the extra map before reading memory stats.
  // Pre-size it to make more allocation unlikely.
  b.extra = make(map[string]float64, 16)
 } else {
  clear(b.extra)
 }
 if b.timerOn {
  runtime.ReadMemStats(&memStats)
  b.startAllocs = memStats.Mallocs
  b.startBytes = memStats.TotalAlloc
  b.start = highPrecisionTimeNow()
 }
 b.duration = 0
 b.netAllocs = 0
 b.netBytes = 0
}
代码还包含一个优化:首次调用时预分配 extra map 的空间,后续调用则复用底层数组,减少内存分配对测试结果的影响。
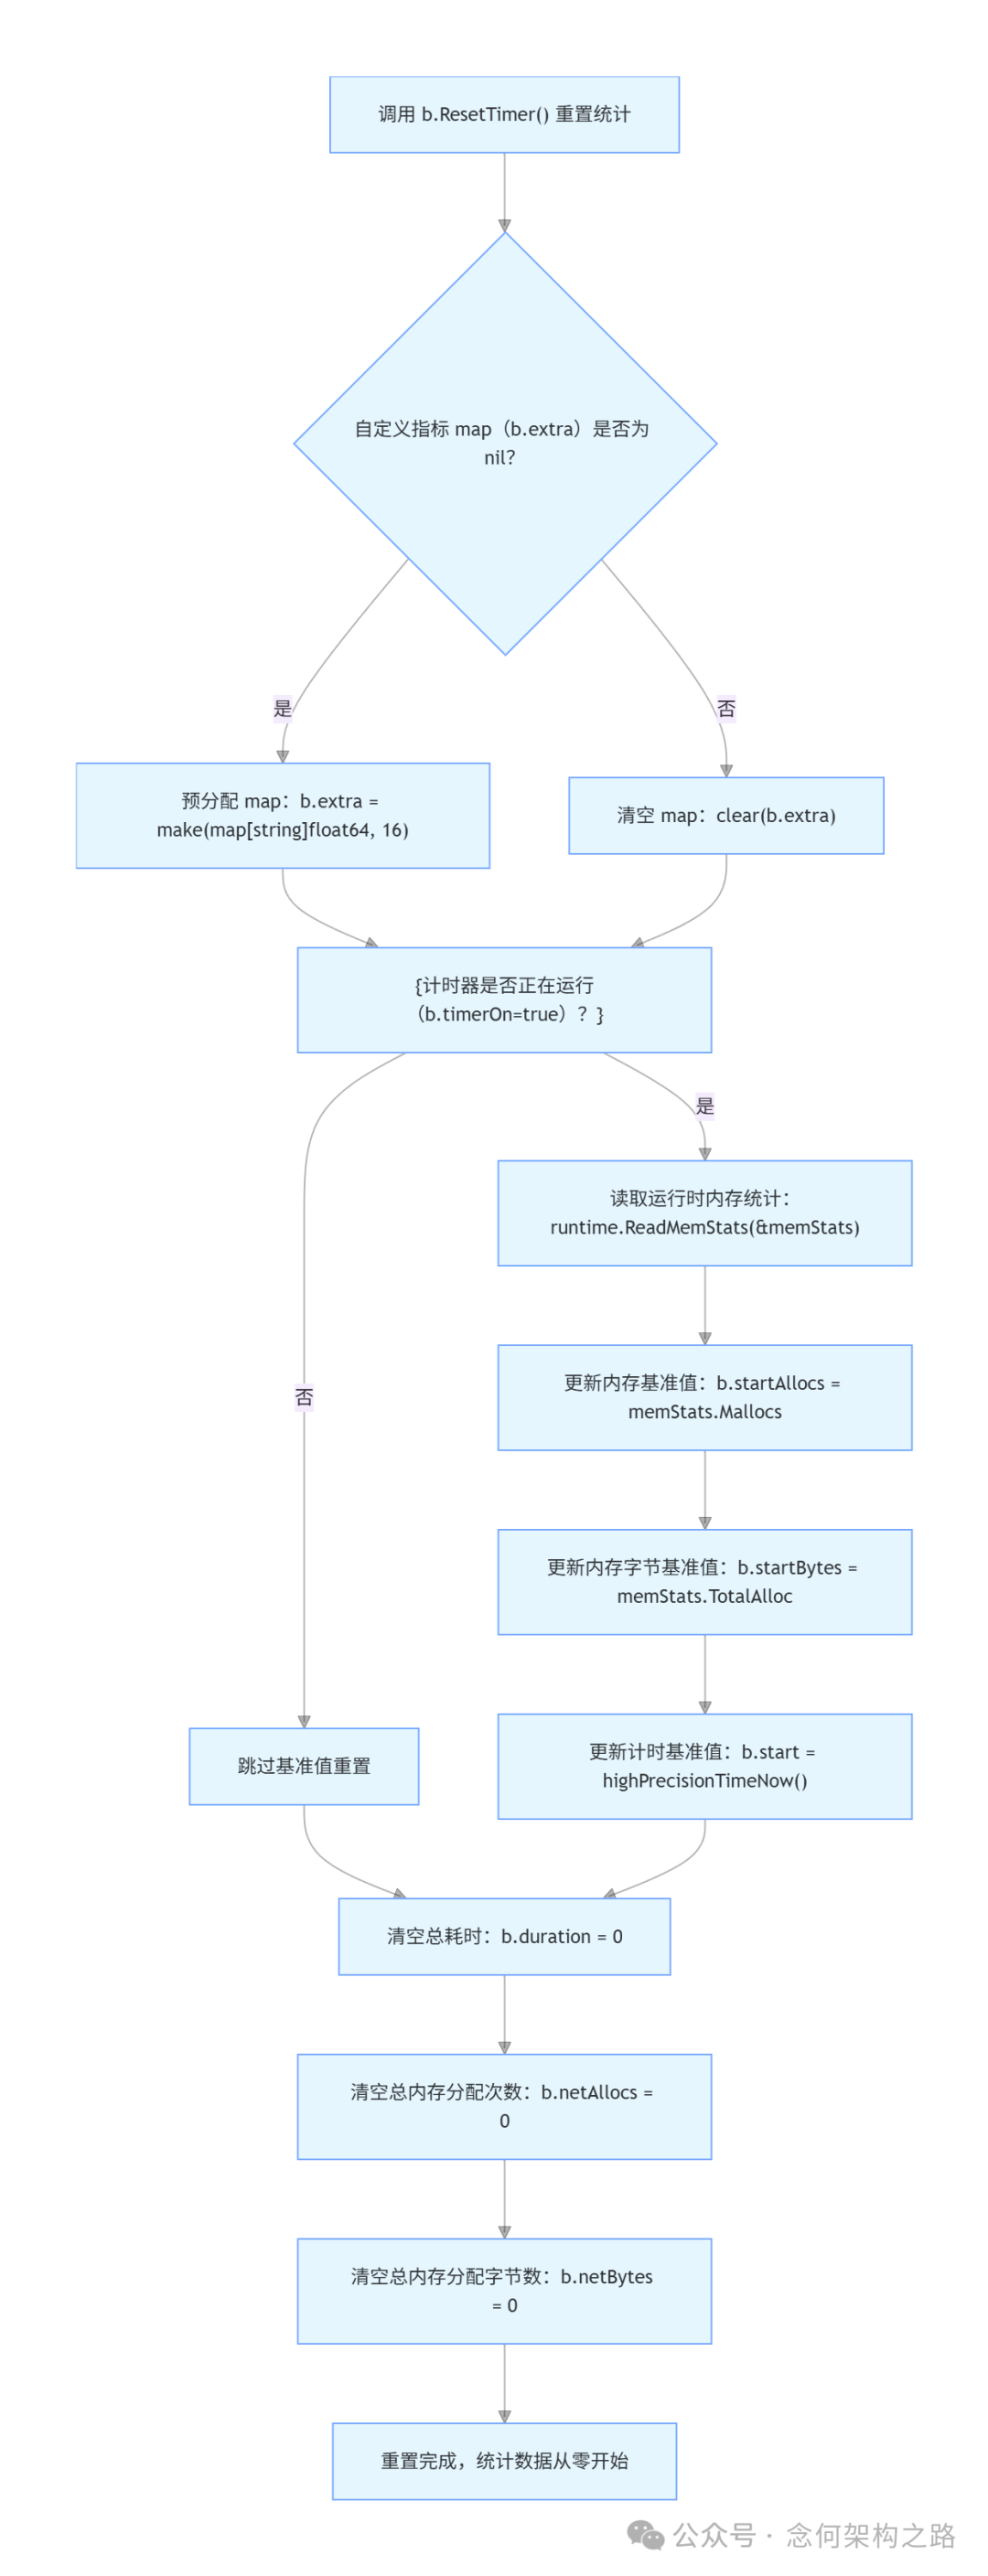
逻辑流程图:
5. 吞吐量统计:SetBytes(n int64)
这个方法非常简单,它记录单次操作处理的字节数 n。一旦设置,测试报告将同时输出 ns/op 和基于吞吐量的 MB/s 指标。
// SetBytes records the number of bytes processed in a single operation.
// If this is called, the benchmark will report ns/op and MB/s.
func (b *B) SetBytes(n int64) { b.bytes = n }
逻辑流程图:
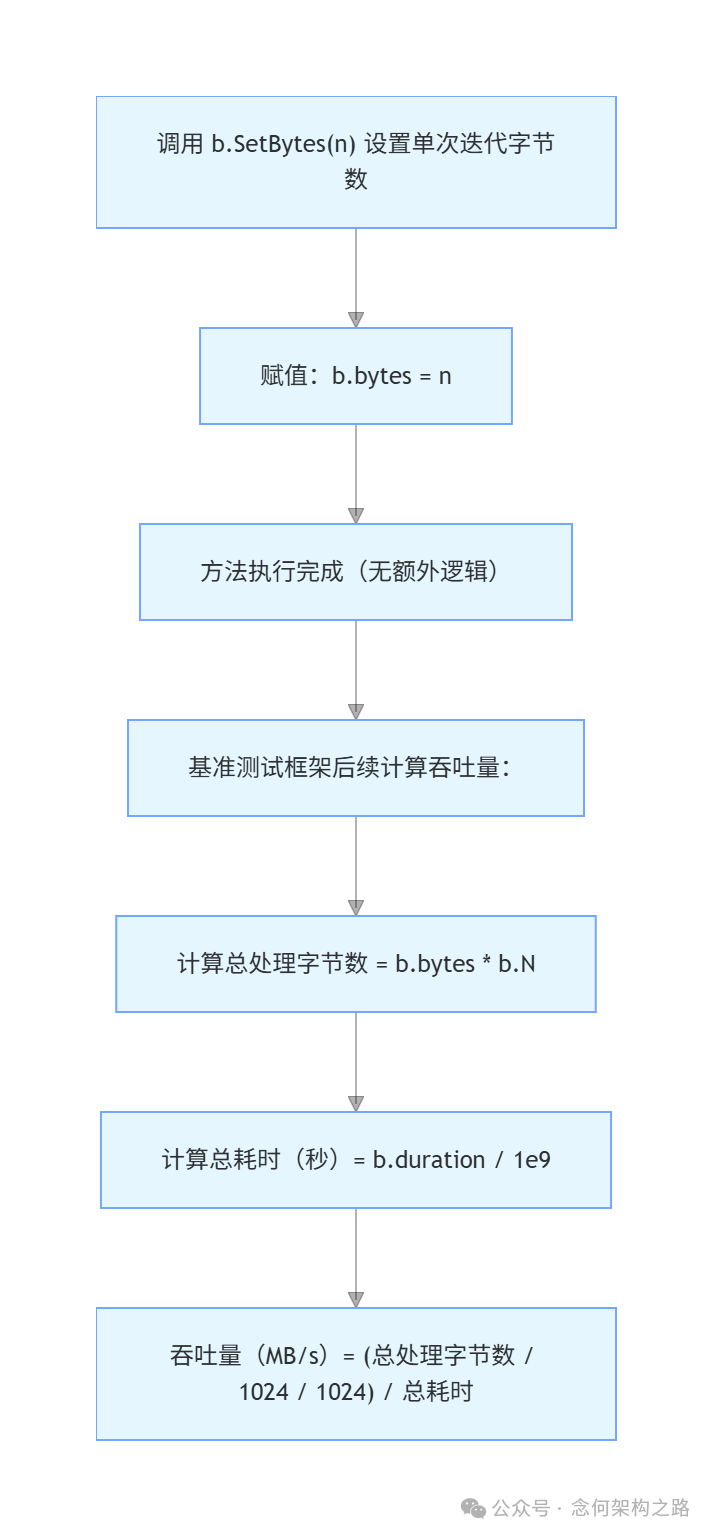
其核心计算公式由测试框架在最后完成:
- 总处理字节数 = 单次迭代字节数 × 总迭代次数
totalBytes = b.bytes × b.N
- 总耗时(秒)= 总有效耗时(纳秒) / 10^9
totalSeconds = b.duration / 1e9
- 吞吐量(MB/s)= 总处理字节数(MB) / 总耗时(秒)
throughputMBps = (totalBytes / 1048576) / totalSeconds
测试示例:
func BenchmarkSetBytes(b *testing.B) {
 b.SetBytes(1024 * 1024) // 设置每次迭代处理1MB数据
 for i := 0; i < b.N; i++ {
  time.Sleep(1 * time.Second) // 模拟耗时操作
 }
}
执行结果:
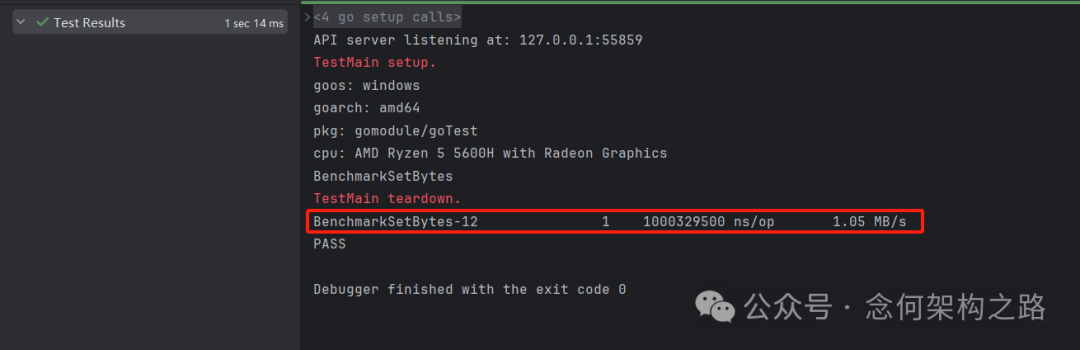
结果中除了 ns/op,还输出了 1.05 MB/s 的吞吐量指标。
6. 单次测试执行:runN(n int)
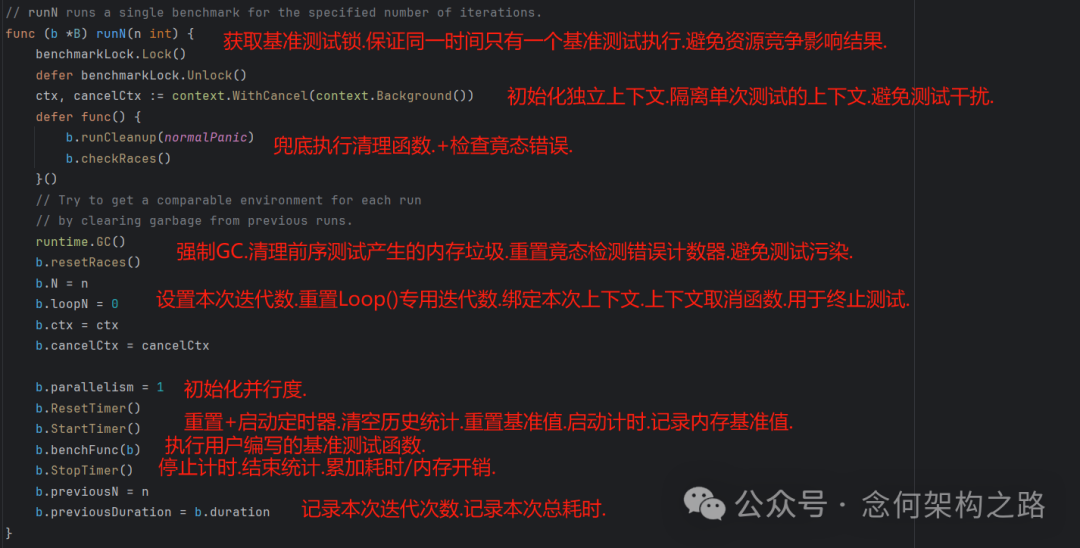
这是框架内部执行单轮基准测试的核心方法。它展示了从准备、执行到收尾的完整流程。
// runN runs a single benchmark for the specified number of iterations.
func (b *B) runN(n int) {
 benchmarkLock.Lock()
 defer benchmarkLock.Unlock()
 ctx, cancelCtx := context.WithCancel(context.Background())
 defer func() {
  b.runCleanup(normalPanic)
  b.checkRaces()
 }()
 // Try to get a comparable environment for each run
 // by clearing garbage from previous runs.
 runtime.GC()
 b.resetRaces()
 b.N = n
 b.loopN = 0
 b.ctx = ctx
 b.cancelCtx = cancelCtx

 b.parallelism = 1
 b.ResetTimer()
 b.StartTimer()
 b.benchFunc(b)
 b.StopTimer()
 b.previousN = n
 b.previousDuration = b.duration
}
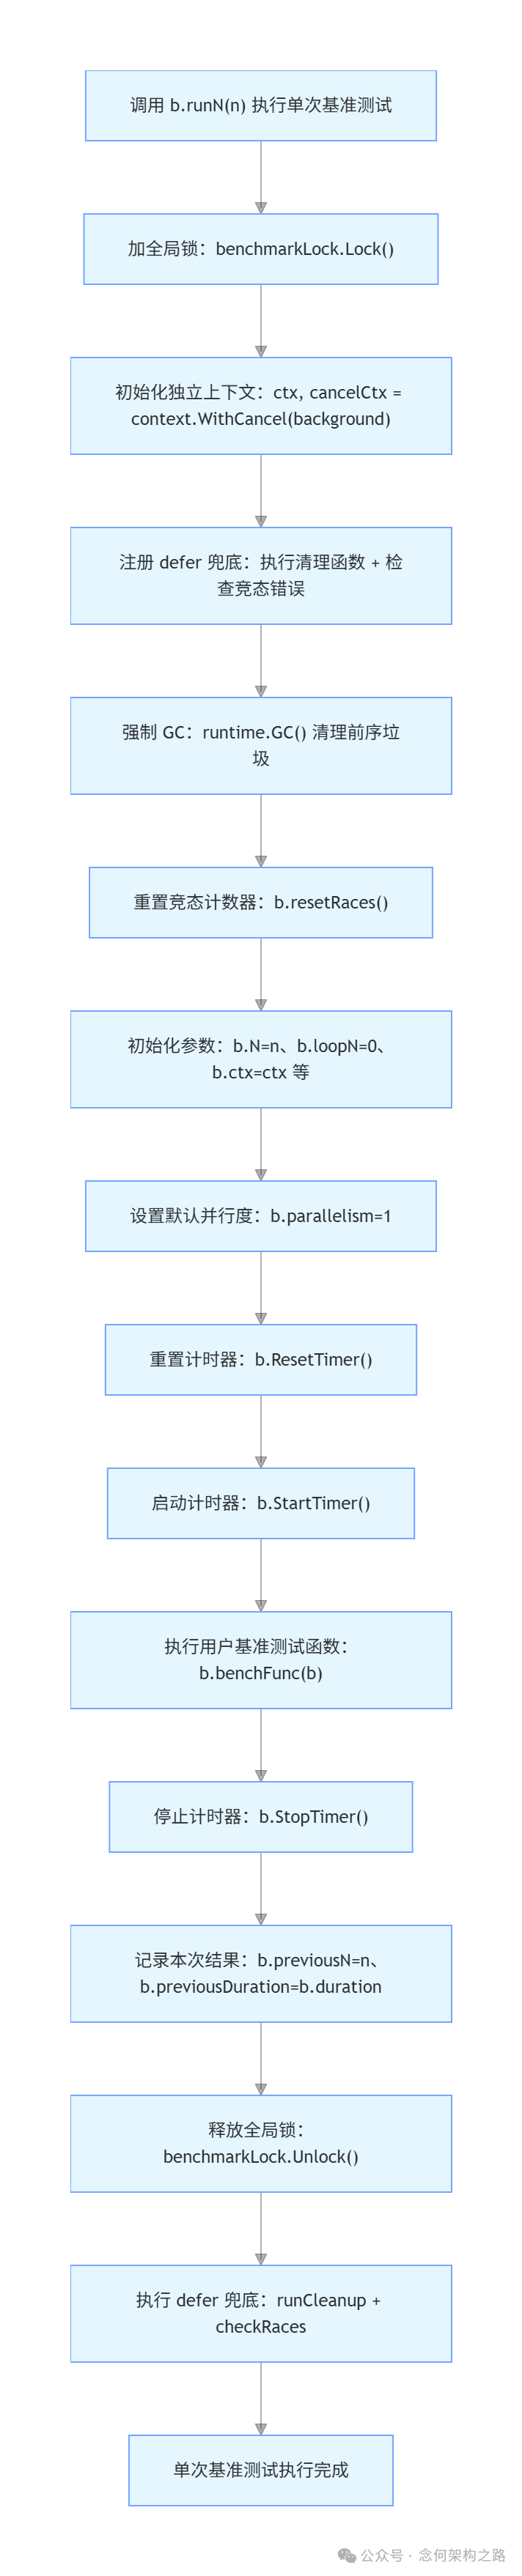
流程关键步骤解析:
- 加锁 (
benchmarkLock.Lock()): 保证全局同时只有一个基准测试运行,避免资源竞争影响结果。
- 环境清理 (
runtime.GC()): 强制垃圾回收,清理前序测试产生的内存垃圾,为本次测试创造干净的环境。
- 参数初始化: 设置本次迭代次数
N、上下文等。
- 计时器操作序列:
ResetTimer() -> StartTimer() -> 执行用户函数 -> StopTimer()。这是统计有效代码性能的标准流程。
- 记录结果: 将本轮迭代次数和总耗时记录到
previousN 和 previousDuration,供后续生成报告使用。
执行流程图:
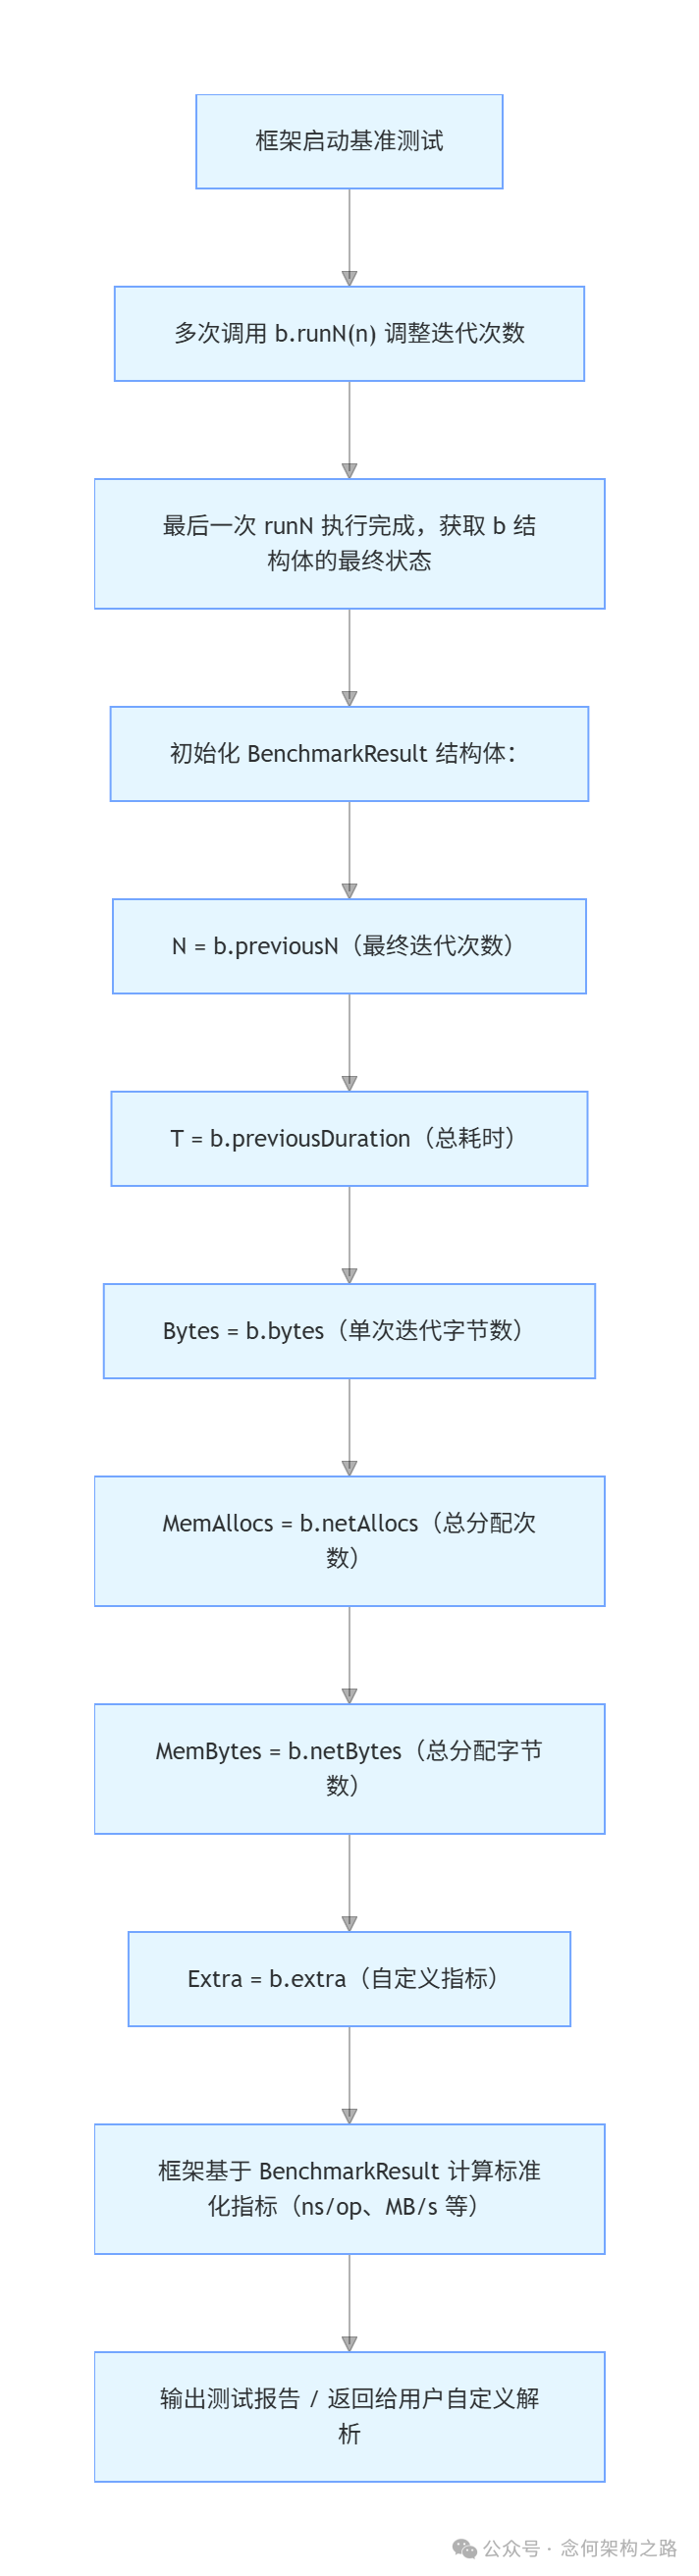
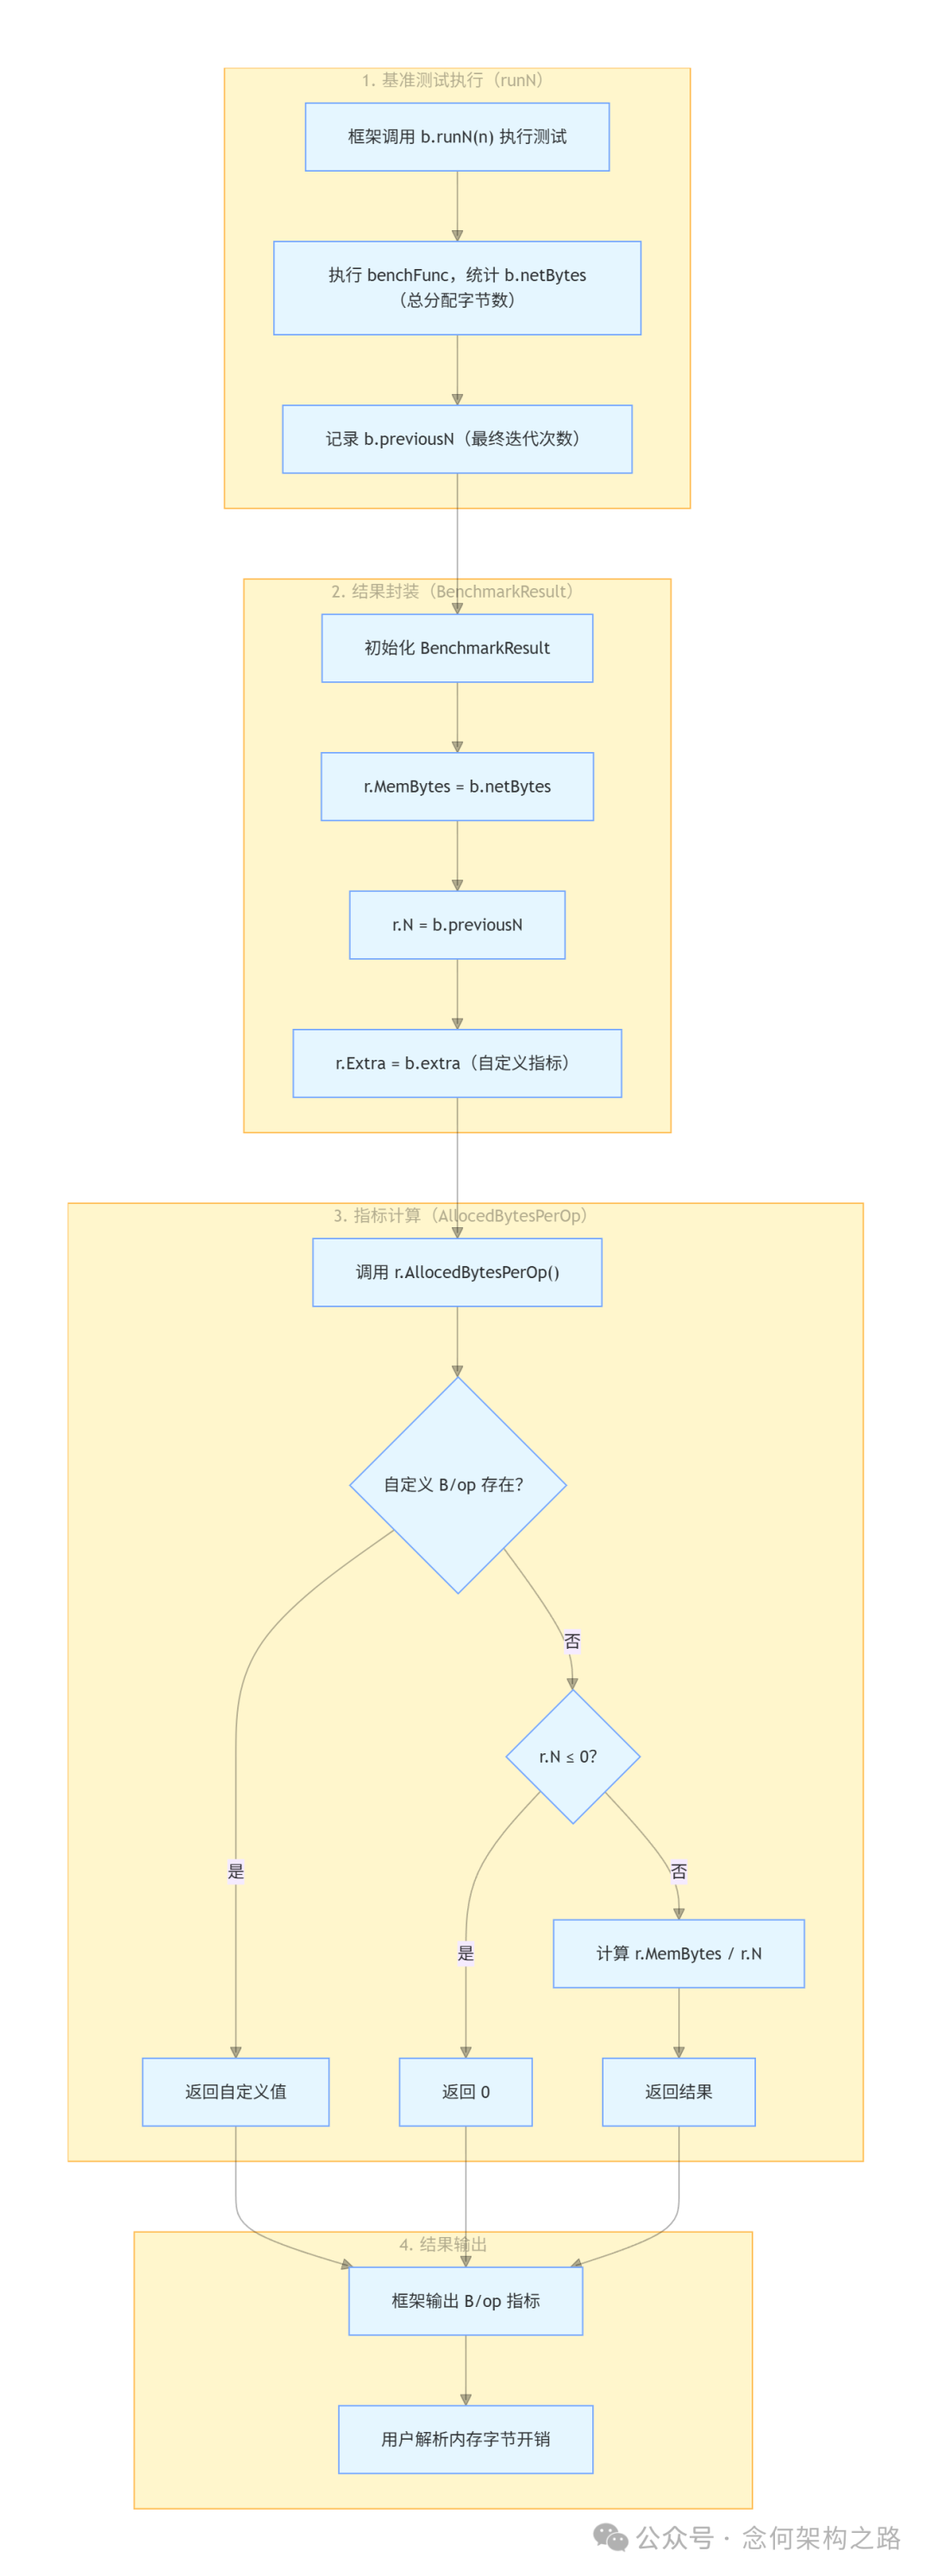
7. 结果计算与内存统计
测试执行完毕后,框架会初始化 BenchmarkResult 结构体来封装最终结果。
// BenchmarkResult contains the results of a benchmark run.
type BenchmarkResult struct {
 N int // The number of iterations.
 T time.Duration // The total time taken.
 Bytes int64 // Bytes processed in one iteration.
 MemAllocs uint64 // The total number of memory allocations.
 MemBytes uint64 // The total number of bytes allocated.

 // Extra records additional metrics reported by ReportMetric.
 Extra map[string]float64
}
字段说明:
N: 最终执行的迭代次数(即最后一轮 runN 的 b.previousN)。T: 总耗时(即最后一轮 runN 的 b.previousDuration)。Bytes: 单次迭代处理的字节数(来自 b.bytes)。MemAllocs: 总内存分配次数(来自 b.netAllocs)。MemBytes: 总内存分配字节数(来自 b.netBytes)。Extra: 用户自定义性能指标(来自 b.extra)。
结果生成流程:
框架基于 BenchmarkResult 提供了两个常用的方法,用于计算标准化的内存指标:
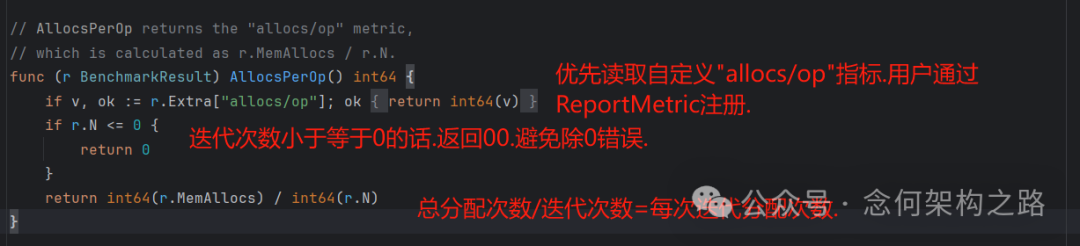
AllocsPerOp() - 计算 "allocs/op"(每次操作的内存分配次数)
// AllocsPerOp returns the "allocs/op" metric,
// which is calculated as r.MemAllocs / r.N.
func (r BenchmarkResult) AllocsPerOp() int64 {
 if v, ok := r.Extra["allocs/op"]; ok {
  return int64(v)
 }
 if r.N <= 0 {
  return 0
 }
 return int64(r.MemAllocs) / int64(r.N)
}
逻辑:优先返回用户通过 ReportMetric 注册的自定义值;否则,用总分配次数除以迭代次数。这是评估程序开发中内存分配效率的关键指标。
AllocedBytesPerOp() - 计算 "B/op"(每次操作的内存分配字节数)
// AllocedBytesPerOp returns the "B/op" metric,
// which is calculated as r.MemBytes / r.N.
func (r BenchmarkResult) AllocedBytesPerOp() int64 {
 if v, ok := r.Extra["B/op"]; ok {
  return int64(v)
 }
 if r.N <= 0 {
  return 0
 }
 return int64(r.MemBytes) / int64(r.N)
}
逻辑与 AllocsPerOp() 类似,用于计算每次操作的平均内存消耗。
总结
通过对 Go 性能测试 框架源码的梳理,我们可以看到其设计的精巧之处:通过 B 结构体管理状态,利用 StartTimer/StopTimer 的幂等性和累加性实现灵活测量,在 runN 中通过环境隔离(GC、锁)保证测试的公平性,最终将原始数据规整为统一的 BenchmarkResult 并计算出易读的标准化指标(如 ns/op, MB/s, allocs/op, B/op)。理解这些原理,有助于我们写出更准确的基准测试,并合理解读测试结果,从而在Go语言开发中持续优化代码性能。
本文深入分析了Go benchmark的内部机制,更多关于Go语言和性能优化的讨论,欢迎在云栈社区交流分享。
 发表于 2026-2-22 06:58:06
|
查看: 231|
回复: 0
发表于 2026-2-22 06:58:06
|
查看: 231|
回复: 0
